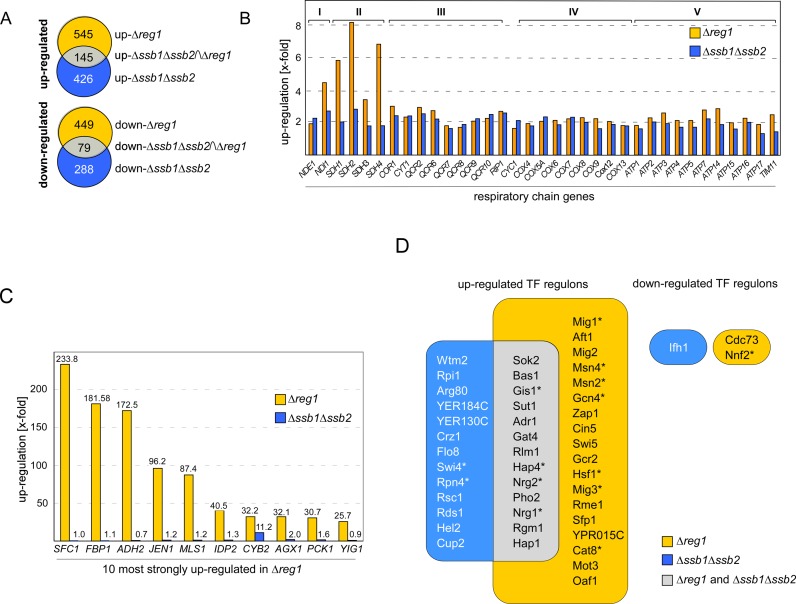
Figure 1.
Transcriptional deregulation in Δssb1Δssb2 and Δreg1 cells. (A) Intersection set of genes deregulated ≥ 1.5-fold (FDR ≤ 0.01) in Δssb1Δssb2 (24) and Δreg1 cells (Supplementary Table S2). (B) Relative expression level of nuclear genes encoding for subunits complex I–V, (74)of the respiratory chain in Δreg1 and Δssb1Δssb2 cells. (C) Relative expression level of the 10 most highly upregulated genes in Δreg1 cells and of the same genes in Δssb1Δssb2 cells. (D) Enrichment of TF targets in the set of up or downregulated genes in Δreg1 or Δssb1Δssb2 cells. The frequency of TF targets in the dataset was compared to their background frequency in the whole genome using Fisher's exact test for over-representation (Supplementary Table S3). Shown are those TFs enriched in the genes up or downregulated in either Δssb1Δssb2 (blue) or Δreg1 (orange) with right-sided P-values ≤ 10−9. The overlap between the two groups is shown in gray. TFs which are direct targets of SNF1 are labeled with an asterisk.

