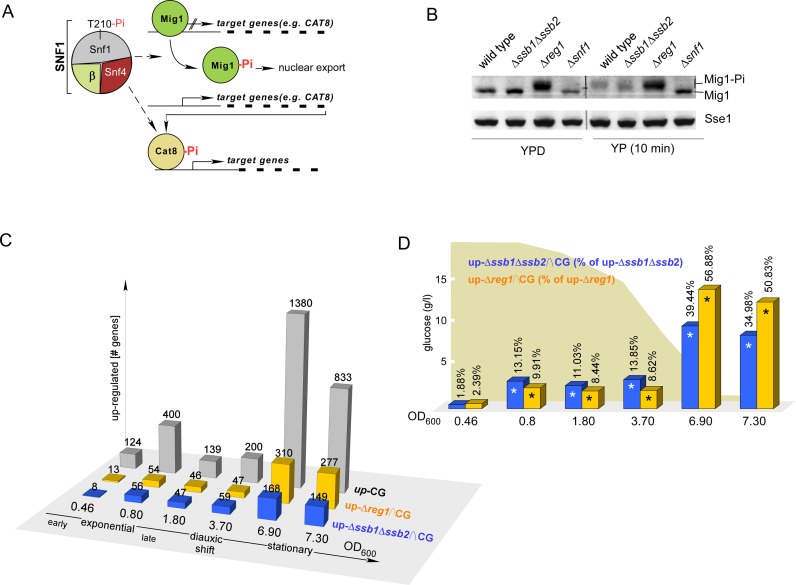
Figure 2.
Transcriptional changes in Δssb1Δssb2 and Δreg1 cells resemble the transcriptional status of batch culture cells at distinct growth phases. (A) The transcriptional repressor Mig1 prevents transcription of many glucose-repressed genes among them CAT8. Cat8 is a major transcriptional activator of many glucose-repressed genes including those depicted in Figure 1C. Phosphorylation of Mig1 by SNF1 promotes nuclear export of Mig1 and releases transcriptional repression. In addition, Cat8 is activated by SNF1-dependent phosphorylation (1,8,75). (B) Mig1 is hyperphosphorylated in Δreg1 but not in Δssb1Δssb2 cells. Strains were grown to early logarithmic phase in the presence of glucose (YPD) followed by a 10 min incubation in the absence of glucose (YP). Total cell extracts were separated via sodium dodecyl sulphate-polyacrylamide gel electrophoresis (SDS-PAGE) and were subsequently analyzed via immunoblotting using an antibody recognizing Mig1 or Sse1 as a loading control. The hyperphosphorylated fraction of Mig1 (Mig-Pi) migrates with higher molecular mass. (C) Comparison of genes upregulated ≥ 1.5-fold during continuous growth in a batch culture (42) relative to the expression level at OD600 = 0.14, with genes upregulated in Δssb1Δssb2 or Δreg1 cells, respectively (24 and Supplementary Table S2). CG: number of genes upregulated in wild-type cells with increasing OD600 (42). Δssb1Δssb2∩CG and Δreg1∩CG indicate the intersecting gene sets. (D) Relative frequency of genes upregulated in batch culture, which are also upregulated in Δssb1Δssb2 or Δreg1 cells. Significant overlap (P < 0.0042, right-sided P-values of Fisher's exact test, Supplementary Table S3) is indicated with an asterisk.

