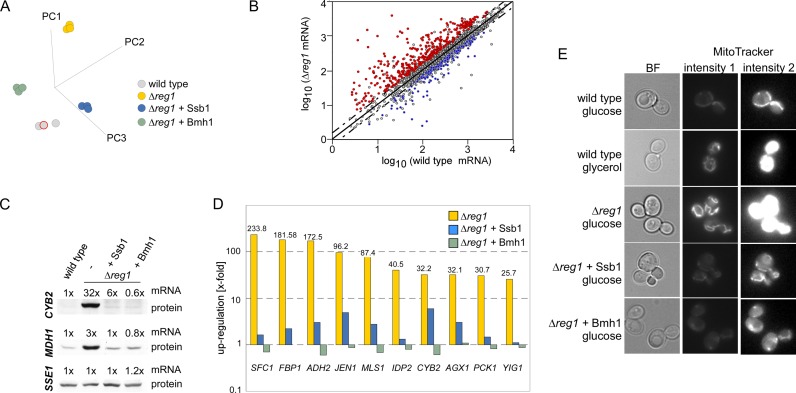
Figure 5.
Reregulation of transcriptional deregulation in a Δreg1 strain by over-expression of Ssb1 or Bmh1. (A) Principal component (PC) analysis of wild-type, Δreg1 and Δreg1 over-expressing Ssb1 or Bmh1. (B) mRNA abundance in wild-type and Δreg1 cells. Mean log values from three independent microarray datasets were plotted with wild-type on the x-axis and Δreg1 on the y-axis. Genes ≥ 1.5-fold deregulated in the in Δreg1 strain are above and below the dotted cut-off lines. Genes deregulated in Δreg1 and reregulated by over-expression of Ssb1 as well as Bmh1 are shown in red (upregulated in Δreg1) or blue (downregulated in Δreg1). (C) Levels of CYB2, MDH1 and SSE1 transcripts and of the corresponding proteins in wild-type, Δreg1 and Δreg1 over-expressing Ssb1 or Bmh1. (D) Relative expression level of the 10 most highly upregulated genes in Δreg1 cells and in Δreg1 cells over-expressing either Ssb1 or Bmh1. (E) The mitochondrial membrane potential in wild-type, Δreg1 and Δreg1 cells over-expressing Ssb1 or Bmh1 was monitored with MitoTracker®Green-FM fluorescent dye. Strains were grown on glucose (YPD) or glycerol (YPGly) as indicated. Shown are two different brightness settings (intensity 1 and 2) for the same set of images. Intensity 2 was adjusted to visualize the weak fluorescence of mitochondria in fermenting strains.

