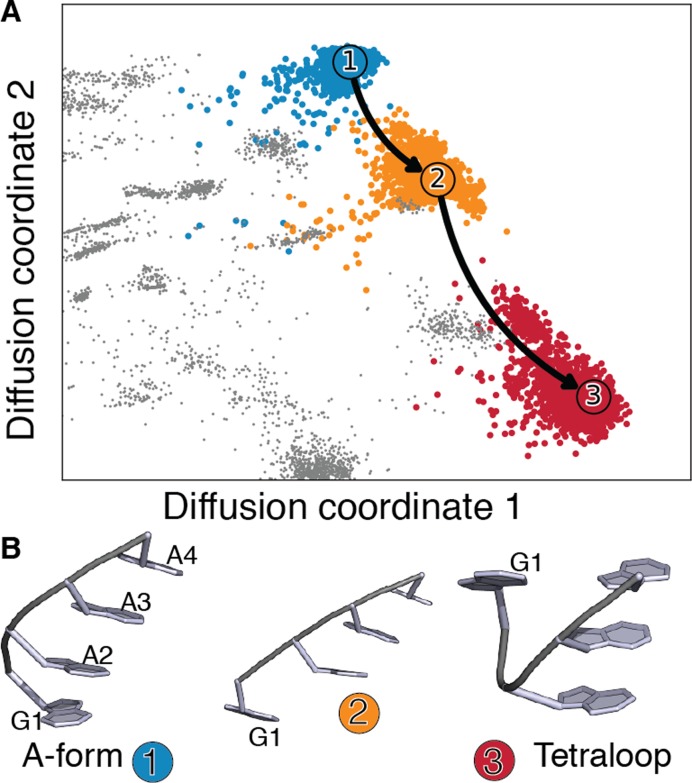
Figure 3.
(A) GAAA A-form helix to loop folding pathways projected on the first two diffusion coordinates. The first folding pathway, contributing for more than 90% of the total flux, is indicated as a solid line. Only the part of the diffusion map containing the clusters that contribute significantly to the folding pathways is shown. See Supplementary Information 8 for the full two-dimensional projection. (B) Centers of the clusters in the main folding pathway, numbered and colored as in panel A.

