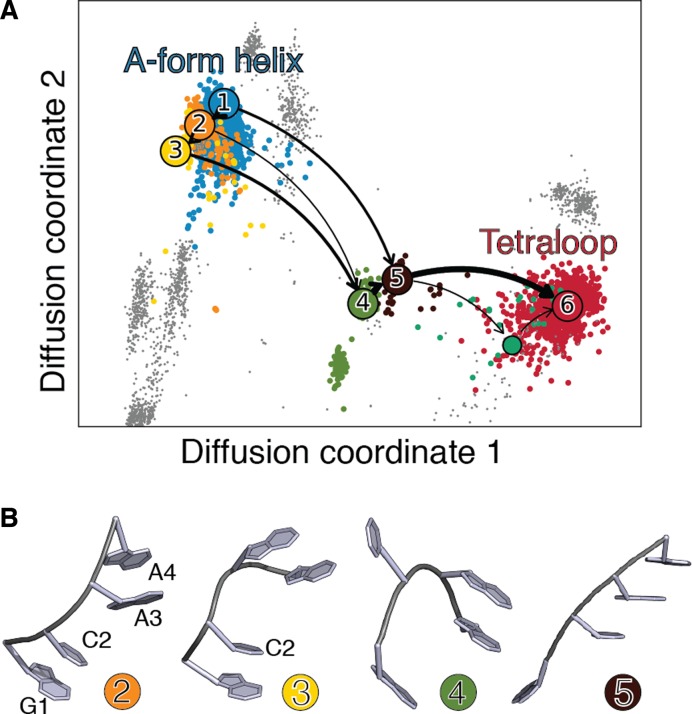
Figure 4.
(A) GCAA helix to loop folding pathways projected on the first two diffusion coordinates. Clusters corresponding to A-form helix and to the loop are colored in blue and red, respectively. On-pathways are shown in colors, gray points correspond to fragments not contributing to the folding pathway. The first three folding pathways, contributing for ≈80% of the total flux, are indicated with black arrows. Line width is proportional to the flux. (B) Centers of the clusters in the main folding pathway, numbered and colored as indicated in panel A. The three-dimensional structures of the A-form helix (cluster 1) and tetraloop (cluster 6) are not shown, as they are equivalent to clusters 1 and 3 in Figure 3.

