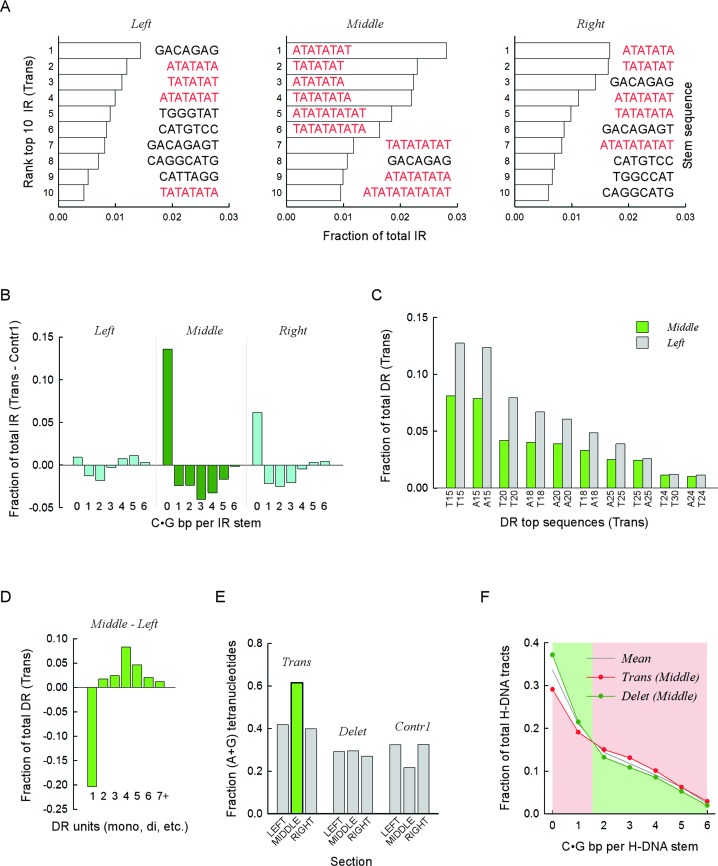
Figure 4.
Specific sequence combinations are strongly associated with translocation and deletion breakpoints. (A) Top ten IR sequences most frequently found near translocation breakpoints. Bars, fractions relative to all IR present in the respective sections, left, middle and right. Color distinguishes between mixed-type sequences (black) and pure (A•T)-containing motifs (red). Sequence corresponds to the upstream (lowest genomic coordinates) repeat, excluding any intervening sequence. Stem, sequence of predicted stem-loop cruciform structures. (B) For each upstream (lowest genomic coordinate) IR sequence containing from zero to six C|G bases, the fraction of the total number of IR found in the left, middle and right sections was computed for the translocation and Contr1 1-kb bins. The fractions obtained for Contr1 were subtracted from those obtained for the translocations and the differences were plotted separately for each section. Negative values indicate overrepresentation of IR sequences in the control bins, whereas positive values indicate overrepresentation in translocation bins. Data for the middle section (dark green) are distinguished from the left and right sections (cyan). (C) Top ten DR sequences most frequently found in the left and middle sections of translocation breakpoints. Bars, fractions relative to all DR present in the respective section. All sequences are (A•T)n mononucleotides, with n ranging from 15 to 30. X-axis, sequence composition of hg19 reference genome sequence, top strand. (D) For DR, the fractions of mono-, di-, tri-, tetra-, penta-, hexa- and >hexa-nucleotides were computed separately for the translocation left and middle sections. Data plotted for the left section were subtracted from those of the middle section. Negative values indicate underrepresentation in the middle section, and vice versa. (E) For DR found in either the left, middle or right sections of the translocation, deletion and Contr1 1-kb bins, the fraction of tetra-nucleotides whose strand sequence composition contained only purines (or pyrimidines, i.e. R•Y tracts) relative to all tetra-nucleotides in the respective section was computed and plotted. The green bar highlights the overrepresentation of R•Y-containing tetranucleotides in the middle section of translocations. (F) For H-DNA, the fraction of repeats containing from zero to six C|G bases in the upstream (lower genomic coordinates) R•Y mirror repeat unit (stem of putative triplex structures) was taken for the middle sections of translocation and deletion 1-kb bins and plotted as a function of C|G occurrences. Note that a value of 0 refers to (A•T)n mononucleotide repeats and that C|G bases could be either contiguous or not. Mean, data for the combined distributions. Pink and green backgrounds highlight the shift in overrepresentation occurring between 1 and 2 C|G.

