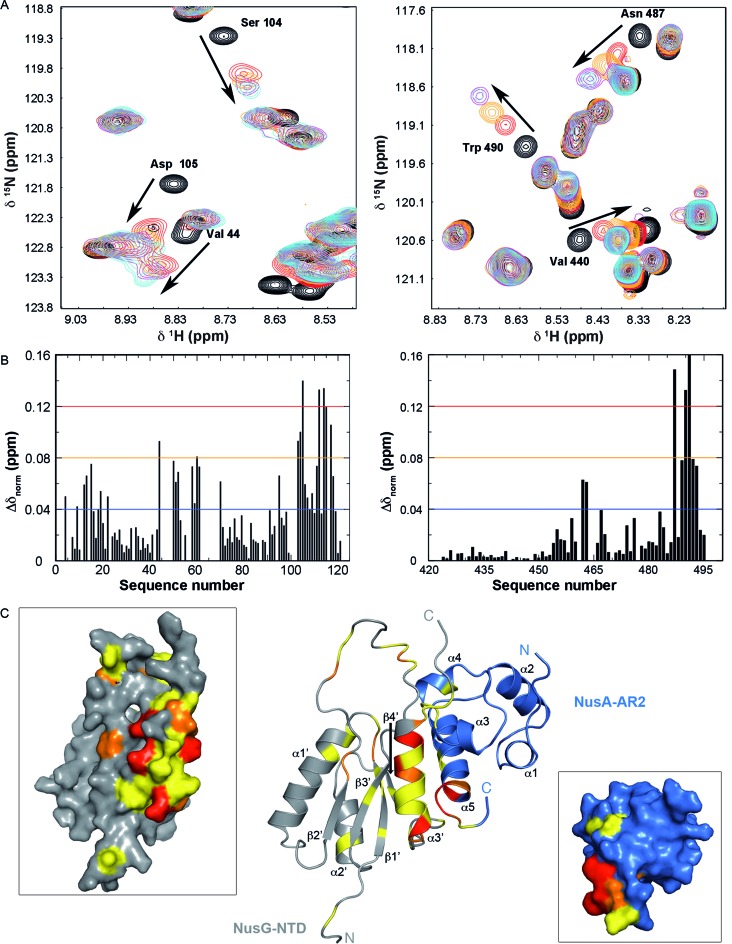
Figure 3.
NusG-NTD:NusA-AR2 complex formation. (A, left) Sections of the [1H,15N]-HSQC-spectra of the titration of 140 μM 15N-NusG-NTD with NusA-AR2. NusA-AR2 was added in a molar ratio of 1:0, black, 1:0.75, red, 1:1.25, orange, 1:2.5, magenta, and 1:3.5, cyan (stock concentration of NusA-AR2: 1.1 mM). (right) Sections of the [1H,15N]-HSQC-spectra of the titration of 100 μM 15N-NusA-AR2 with NusG-NTD. Spectra corresponding to molar ratios 1:0, 1:0.5, 1:1, 1:2.5, and 1:3 are in black, red, orange, magenta, and cyan, respectively (stock concentration of NusG-NTD: 300 μM). Arrows indicate chemical shift changes during the titrations, selected signals are assigned. (B) HSQC-derived normalized chemical shift changes versus sequence position. (Left) Δδnorm of 15N-NusG-NTD on titration with NusA-AR2; (right) Δδnorm of 15N-NusA-AR2 on titration with NusG-NTD. Horizontal lines: significance levels of Δδnorm (ppm) = 0.12, red; = 0.08, orange; = 0.04, blue. (C) Model of the NusA-AR2:NusG-NTD complex. The complex was generated with HADDOCK using the chemical shift perturbations of the [1H,15N]-HSQC titrations as restraints. The model with the best HADDOCK score is depicted. NusA-AR2 (PDB ID: 2K06), blue, and NusG-NTD (PDB ID: 1WCN), grey, are in cartoon representation. The normalized chemical shift changes from (B) are mapped on the structures (0.04 ppm < Δδnorm < 0.08 ppm, yellow; 0.08 ppm < Δδnorm < 0.12 ppm, orange; Δδnorm > 0.12 ppm, red). Panels show the surface representations of NusG-NTD, left, and NusA-AR2, right.

