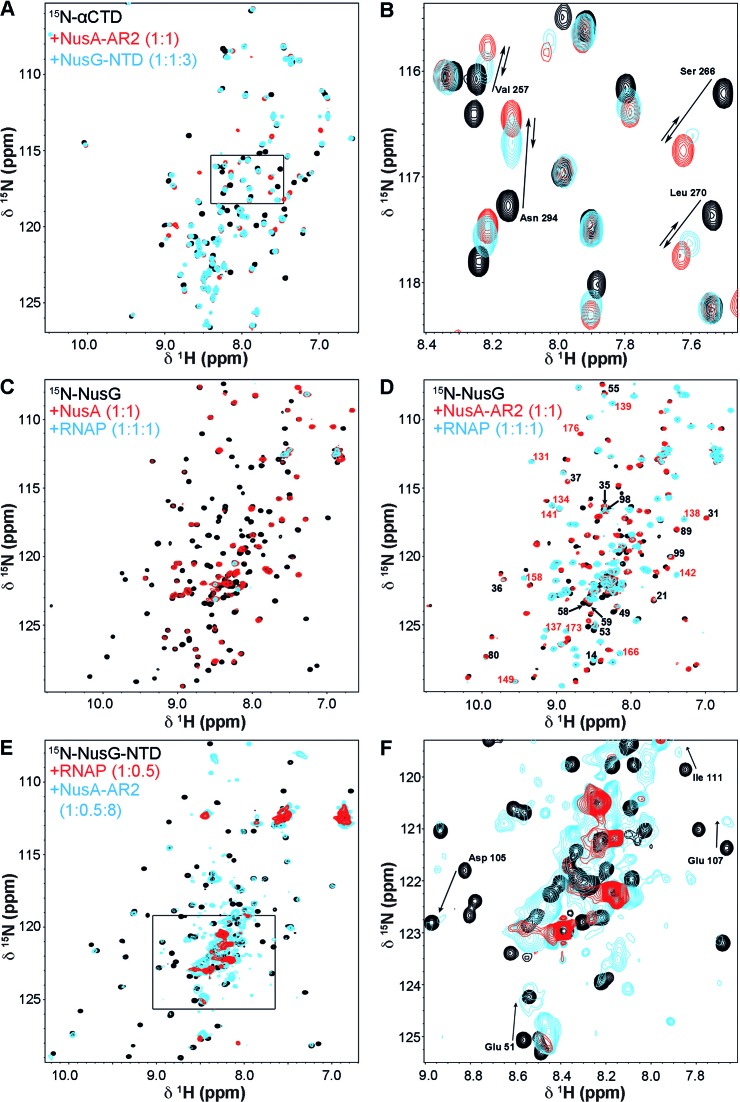
Figure 4.
NusG-NTD:NusA-AR2 interaction in the presence of RNAP. (A and B) [1H,15N]-HSQC displacement experiment of NusA-AR2 from 15N-αCTD by NusG-NTD. Black, 15N-αCTD; red, 15N-αCTD:NusA-AR2 = 1:1; blue, 15N-αCTD:NusA-AR2:NusG-NTD = 1:1:3. The concentration of 15N-αCTD was always 50 μM. The rectangle in (A) indicates the section as in (B). The arrows in (B) show the changes in the chemical shifts of selected residues. (C) NusG binds to NusA in the presence of RNAP. [1H,15N]-HSQC spectra of 15N-NusG, black, 15N-NusG in the presence of NusA (molar ratio 1:1), red, and 15N-NusG in the presence of NusA and RNAP (molar ratio 1:1:1), cyan. (D) NusG binds to NusA-AR2 in the presence of RNAP. [1H,15N]-HSQC spectra of 15N-NusG, black, 15N-NusG in the presence of NusA-AR2 (molar ratio 1:1), red, and 15N-NusG in the presence of NusA-AR2 and RNAP (molar ratio 1:1:1), cyan. Selected signals are labeled (black, NusG-NTD signals; red, NusG-CTD signals). The concentration of 15N-NusG was 50 μM in all experiments in (C) and (D). (E) NusA-AR2 removes NusG-NTD from RNAP. [1H,15N]-HSQC spectra of 15N-NusG-NTD, black, 15N-NusG-NTD in the presence of RNAP (molar ratio 1:0.5), red, and 15N-NusG-NTD in the presence of RNAP and NusA-AR2 (molar ratio 1:0.5:8), cyan. The concentration of 15N-NusG was always 50 μM. The rectangle in (E) indicates the section as in (F). In (F), selected signals are assigned with arrows indicating changes in their chemical shifts corresponding to the complex formation of 15N-NusG-NTD and NusA-AR2.

