Figure 2.
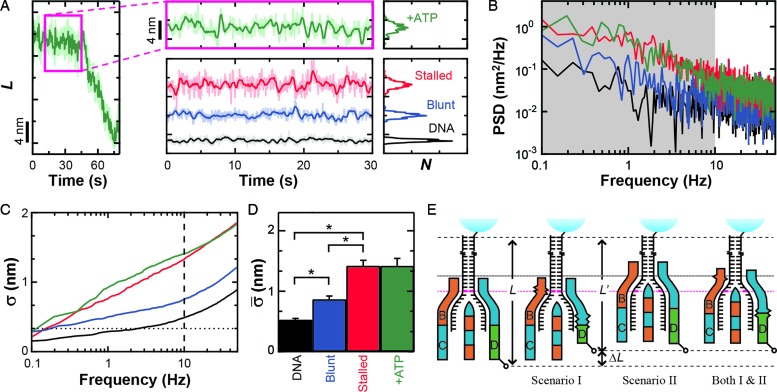
Conformational dynamics in the RecBCD–DNA complex. (A) Measurement of L for RecBCD unwinding DNA in the presence of ATP (green) shows large variations in DNA length between fitted steps. We compare this motion to RecBCD stalled on partially unwound DNA due to removal of ATP (red), RecBCD bound to blunt-ended DNA without ATP (blue) and DNA attached directly to the surface (black). Pink box is a zoom-in. Traces smoothed to 10 Hz (light) and 1 Hz (dark). Histograms of the 1 Hz data are shown at the right. Color scheme is the same in (B–D). (B) Power spectral density (PSD) of the data in (A), with the gray region highlighting the frequency range 0.1–10 Hz. (C) Integral of the PSD, which according to Parseval's Theorem is the equivalent of the standard deviation (σ). Dashed line at 10 Hz and dotted line at 1 bp. (D) Bar graph displays the mean standard deviation ( , bandwidth 0.1–10 Hz, N ≥ 5) for the conditions in (A). Error bars are the standard error in the mean. An asterisk represents a statistical significance of P < 0.05. (E) Conformational dynamics (ΔL) could be due to conformational changes within RecBCD (Scenario I), motion of RecBCD relative to the dsDNA (Scenario II) or both (Scenario I & II).

