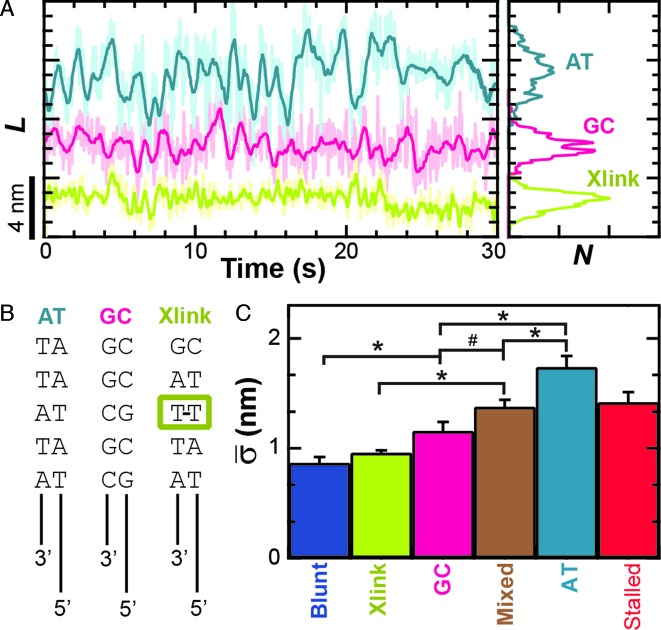
Figure 4.
Conformational dynamics are sequence dependent. (A) Measurement of L for RecBCD bound to 5′-(dT)10 tailed DNA ends show increased dynamics when the first five bp ahead of the ssDNA–dsDNA junction are all AT bp (light blue), whereas the dynamics are suppressed when those base pairs are all GC (pink). Conformational dynamics were further suppressed by an interstrand cross-link 2 bp ahead of the ssDNA–dsDNA junction (light green). (B) Schematic of constructs used in (A). (C) Bar graph of the mean standard deviation for the conditions in (A). Also shown are the cases for RecBCD bound to: blunt-ended DNA (blue), stalled DNA after partial unwinding (red) and 5′-(dT)10 DNA with a mixed upstream double-stranded DNA sequence (brown). Conditions with asterisks have P < 0.05 while the number symbol (#) corresponds to P = 0.08.

