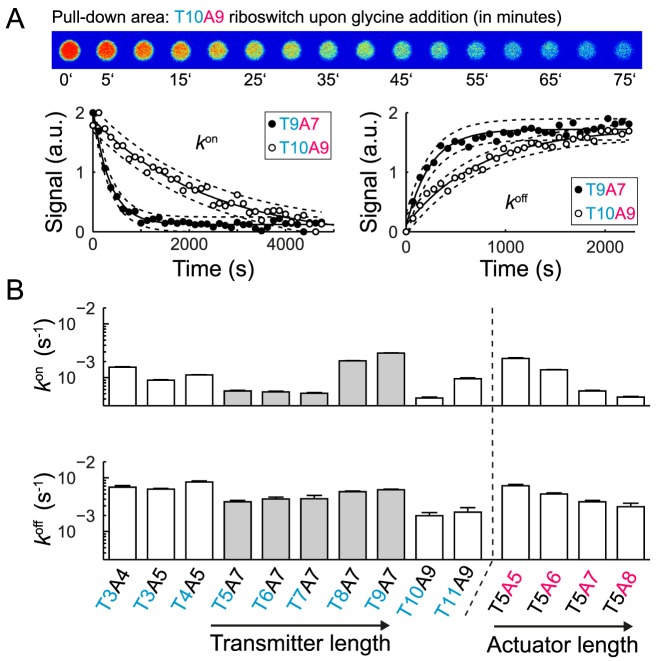
Figure 4.
Kinetic characterization of selected glycine fluorescence riboswitches on chip. (A) Top: fluorescence images representing the response time of the riboswitch (T10A9). For this the glycine concentration was rapid exchanged over the pulled-down areas on the microfluidic chip and the fluorescence signal change recorded. Bottom: representative fluorescence time traces of two riboswitches upon addition of 0.01 M glycine (left) and complete depletion of glycine (right). B) Apparent kon and koff rates for 12 fluorogenic glycine riboswitches with different transmitter-actuator lengths. The rates were obtained by fitting a single exponential function to the fluorescence time traces.

