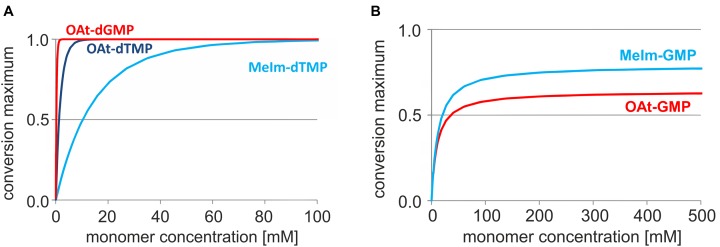
Figure 10.
Concentration dependence of yield. Simulated yields of primer extension after 10 days reaction time versus monomer concentration. (A) Reaction of OAt-dGMP on template 9c or OAt-dTMP or MeIm-dTMP on template 9a. The following values were used for the simulation: Kd (OAt-dGMP) 26 mM, Kdh (dGMP) 27 mM; kcov = 8.6 h−1, khydr = 0.093 h−1; Kd (OAt-dTMP) 71 mM, Kdh (TMP) 241 mM; kcov = 1.69 h−1, khydr = 0.044 h−1 and Kd (MeIm-TMP) 236 mM, Kdh (TMP) 241 mM; kcov = 0.35 h−1, khydr = 0.024 h−1. (B) Extension of RNA primer 13 with MeIm-GMP on template 12c, or OAt-GMP on template 12c. The values used for the simulation are Kd (MeIm-GMP) 23 mM, Kdh (GMP) 27 mM, kcov = 0.020 h−1 and khydr = 0.013 h−1; as well as Kd (OAt-GMP) 10 mM, kcov = 0.095 h−1 and khydr = 0.147 h−1. We note that neither of the two monomers is expected to yield full conversion, even at unrealistically high monomer concentration. Please also note that these are not kinetics, but concentration versus yield curves.

