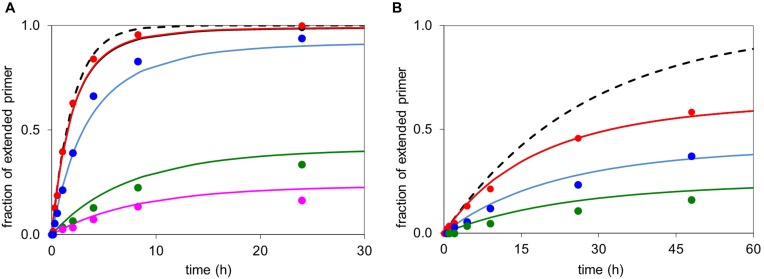
Figure 6.
Time-conversion curves for extension of an aminoterminal primer: experimental data points (symbols) and simulated time course (lines). (A) Primer 10, template 9t, and monomer OAt-dAMP (2a) at 3.6 mM (red), 1.8 mM (blue), 0.36 mM (green) or 0.18 mM (purple) concentration, simulation with Kd = 20 mM, Kdh = 38 mM; kcov = 3.2 h−1 and khydr = 0.109 h−1. The broken black line shows hypothetical kinetics without the formation of an inhibitor through hydrolysis of 3.6 mM 2a. (B) Primer 10, template 9t and MeIm-dAMP (3a) at 5.0 mM (red), 2.5 mM (blue) or 1.3 mM (green) concentration; simulation with Kd = 37 mM, Kdh = 38 mM; kcov = 0.31 h−1, khydr = 0.037 h−1. Again, the broken black line is hypothetical kinetics without hydrolysis/inhibition at 5 mM monomer concentration.

