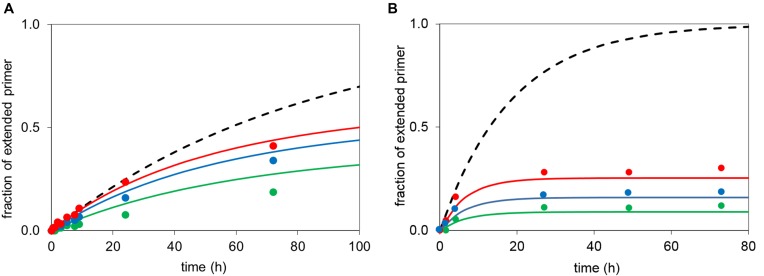
Figure 7.
Simulated extension of an RNA primer according to Equation (1) (lines) with experimental data points (symbols) of the corresponding reactions. (A) Primer 13, template 12c (36 μM and MeIm-GMP (6g) at 36 mM (red), 24 mM (blue) or 12 mM (green); simulation with Kd = 23 mM, Kdh = 27 mM; kcov = 0.020 h−1, khydr = 0.012 h−1. The broken black line shows hypothetical kinetics without hydrolysis at 36 mM monomer. (B) Primer 13, template 12c and OAt-GMP 5g at 7.2 mM (green), 3.6 mM (blue), 1.8 mM (red) concentration, simulated with Kd = 11 mM; Kdh = 35 mM; khydr = 0.147 h−1, kcov = 0.095 h−1 and with the broken black line showing hypothetical kinetics without hydrolysis/inhibition at 7.2 mM nucleotide. Note that the dissociation constants are lower limits of the true value (compare Table 3).

