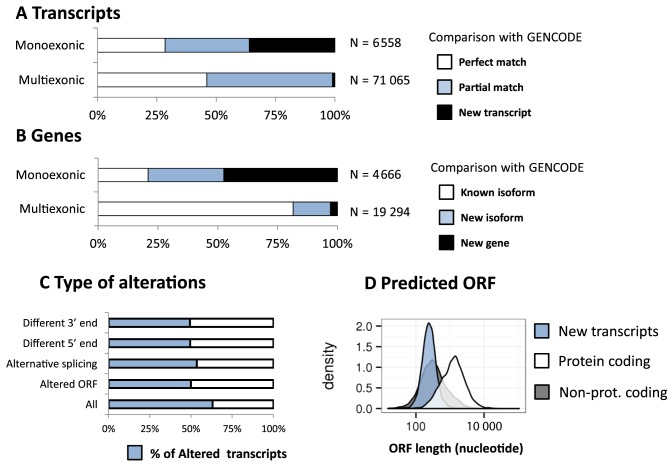
Figure 2.
Overview of the Observed Transcriptome (ObsT). (A) Distribution of ObsT monoexonic transcripts and multiexonic transcripts that either perfectly overlap a Gencode transcript (white), or share at-least one exon–exon junction with a Gencode transcript (blue), or share no exon–exon junctions with Gencode transcript (black). (B) as in (A) but using genes rather than transcripts. (C) The frequency of transcripts’ alterations found in the ObsT compared to the known reference sequence in Gencode. (D) The predicted ORF length of known-protein-coding transcripts (white), known non-protein-coding transcripts (grey) and new transcripts found in the ObsT (blue); y-axis: the transcript density over the ORF-length; x-axis: ORF-length on a log-10 scale.

