Figure 3.
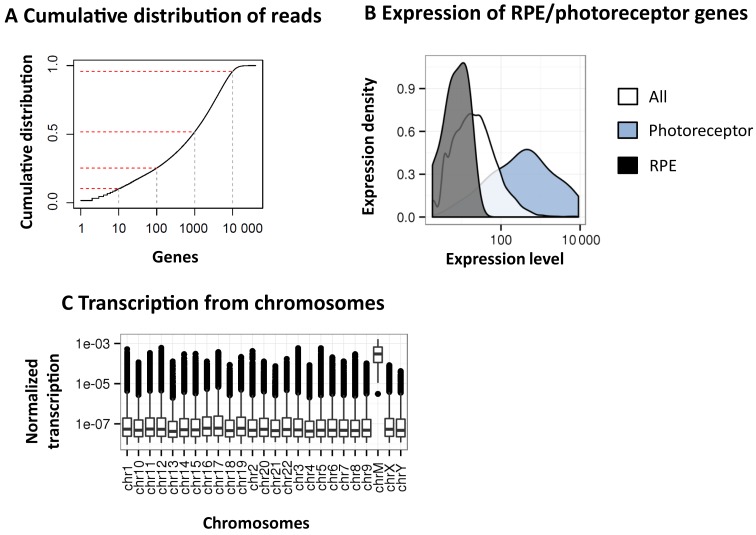
Overview of the Reference Transcriptome (RefT). (A) Cumulative distribution of mapped reads on gene regions prior to normalisation and filtering. y-axis: cumulative distribution of reads; x-axis: the number of genes sorted by coverage in descending order (log10). Top-1, top-10, top-100, top-1000 and top-10K expressed genes are marked. (B) Density distribution of expression for the genes in Gencode (white), for the photoreceptor-specific genes (blue), and for RPE-specific genes (black). Gene density (y-axis) over the normalised expression level (x-axis) on a log-10 scale is shown. (C) The average expression of genes in the human retina divided by chromosome.

