
Figure 3.
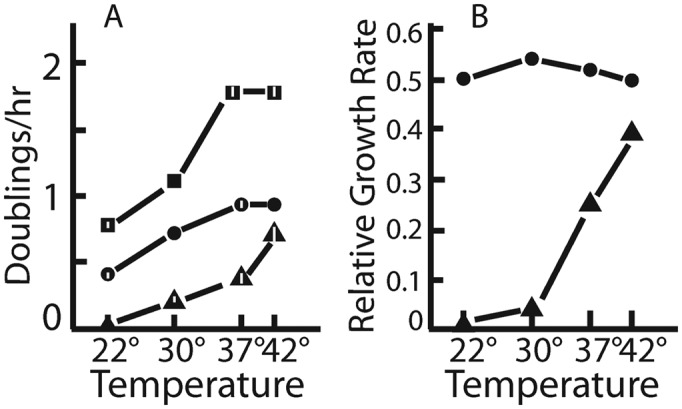
Growth rates of mutants and parent at different temperatures. (A) Actual growth rates. (B) Growth rates of each mutant strain normalized to the growth rate of the parent growth rate at the same temperature. Squares: wild-type; triangles: uL4-Δloop; circles: uL22-Δloop. Verical bars indicate standard error of the mean. Where none is indicated, the standard error of the mean was too close to 0 to show up in the figure. Number of biological replicates: N = 3 for all growth rates measurements, except for uL4-Δloop at 22° (N = 2) and uL4Δloop at 30° (N = 1).