
Figure 8.
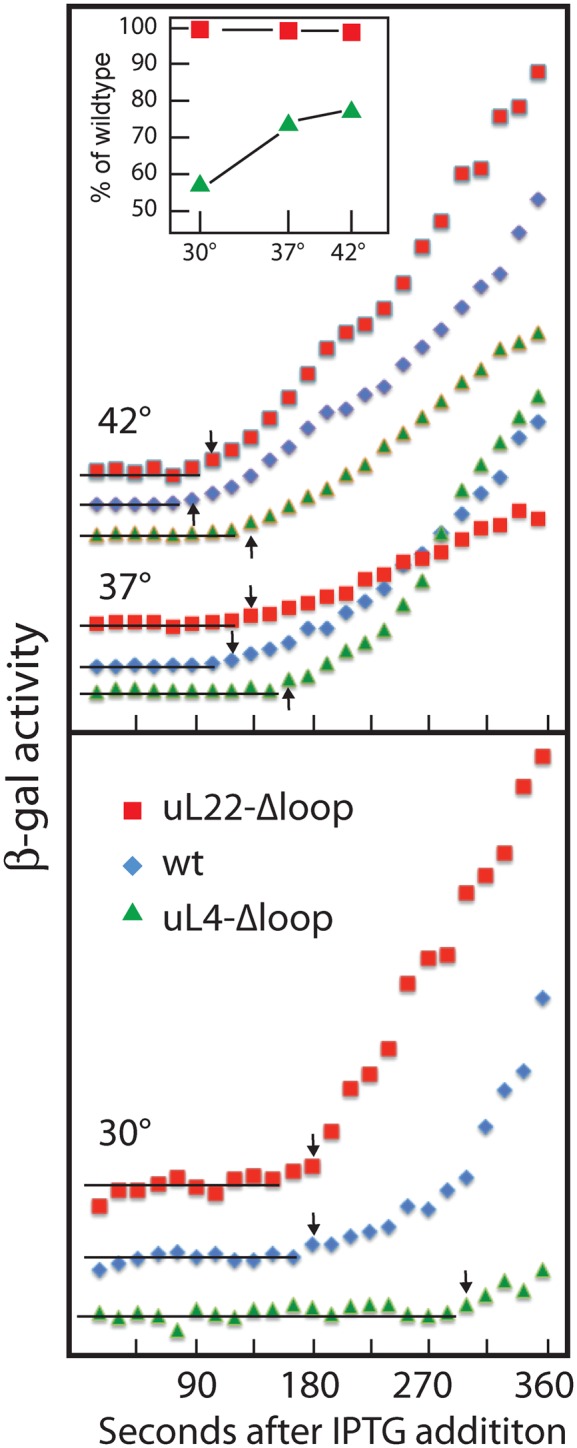
Kinetics of β-galactosidase induction at different temperatures. Cultures were grown at 30°, 37° and 42° and induced with IPTG. Aliquots were withdrawn at the indicated times and analyzed for β-galactosidase. The enzymes activities were graphed as a function of time after induction. Data for 37° and 42° are shown in the top panel and 30° in the bottom panel. The horizontal lines indicate basal levels and the arrows indicate the first point of a monotonous increase of enzyme activity. The time of the last point of the basal level, i.e. the point immediately before the arrow, is taken to be the induction delay. Symbols are defined on the figure. Inset is a plot of the relative translation rates of mutants compared to wild-type at the same temperature.