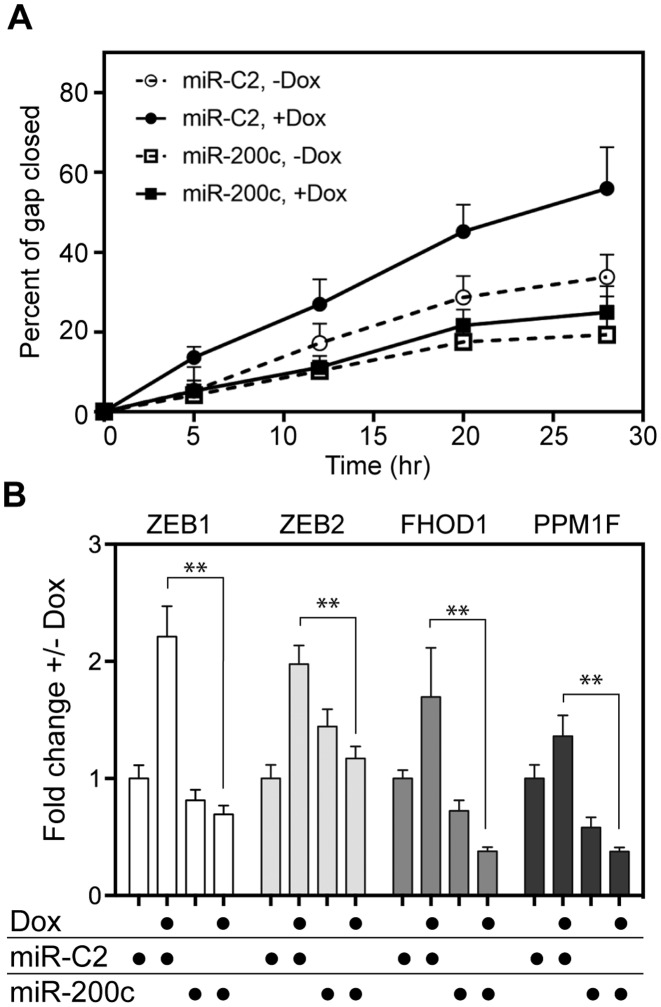
Figure 5.
miR-200c reverses hPMR1 stimulation of motility and increases in miR-200 target gene expression. MCF-7 cells carrying the active hPMR1 transgene were transfected with miR-200c or a control miR (miR-C2) 24 hr prior to addition of doxycycline to half of the cultures. (A) The matrix was scored at the time of doxycycline treatment and motility was monitored as in Figure 1B. (B) Cytoplasmic RNA recovered from a parallel set of cultures was analyzed as in Figure 3B by RT-qPCR for ZEB1, ZEB2, PPM1F and FHOD1 mRNA. The results represent the mean ± standard deviation (n = 3). The double asterisks (∗∗) indicate P < 0.001 by Student's t-test.

