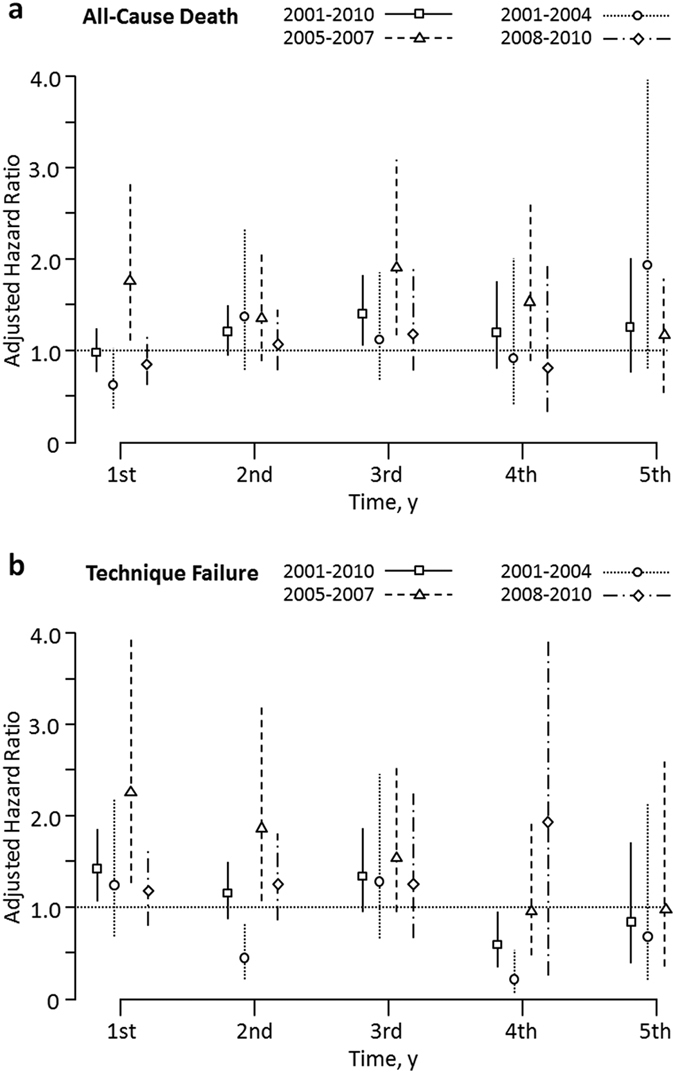
Figure 4.

Adjusted hazard ratios of APD to CAPD from the final multivariate model for (a) all-cause mortality and (b) technique failure, by year. The APD patients had a significantly higher risk of all-cause mortality in the 2005–2007 sub-period, particularly in the 1st and 3rd years. In contrast, a lower risk of all-cause mortality in the 2001–2004 sub-period was found, particularly in the 1st year. The adjusted hazard ratios of the technique failure fluctuated with a notably higher risk in the 1st and 2nd years of the 2005–2007 sub-period and a considerably lower risk in the 2nd and 4th years of the 2001–2004 sub-period. Patients were followed till December 31, 2011.
