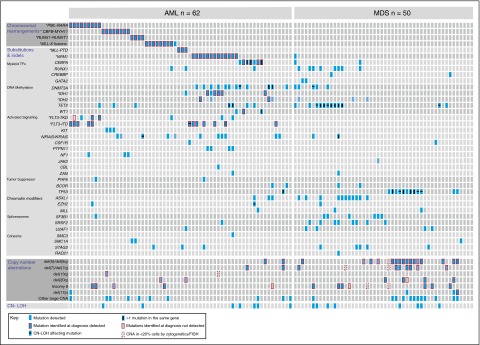
Figure 2.
Genomic characterization of myeloid malignancies using Karyogene. Individual AML (n = 62) and MDS (n = 50) samples are represented in columns and genetic mutations in rows. AML samples were unselected whereas MDS samples were pre-selected to harbor chromosomal copy number changes. Mutations are grouped into chromosomal translocations (top), substitutions and indels (middle), CNAs (bottom), and CN-LOH events (bottom row). Clinically relevant CNAs are depicted in separate rows and “other large CNAs” refers to changes affecting regions larger than 3 mbp (described in detail in supplemental Figure 3). The presence of mutations in different contexts is indicated according to the key (bottom left). TF, transcription factor.

