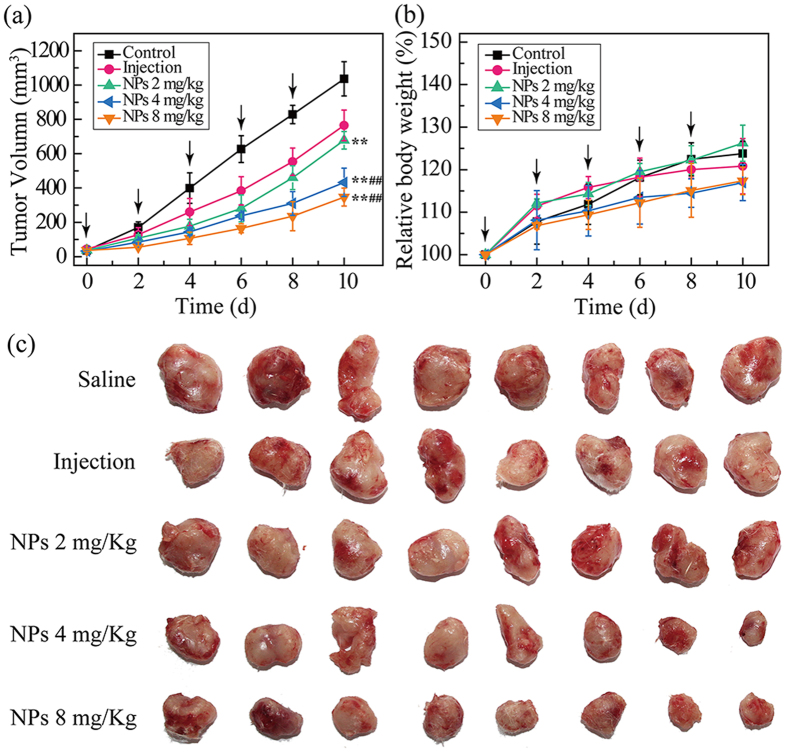
Figure 7. In vivo antitumor efficacy of MTX/PGD NPs by the intravenous route: tumor volume change of 4T1 bearing BALB/c mice (a), body weight change (b), tumor images (c) in 4T1 bearing BALB/c mice.
For each animal, five consecutive doses were given (marked by arrows). Data represent mean ± SD (n = 8). **p < 0.001 vs. saline control group, ##p < 0.001 vs. MTX injection.

