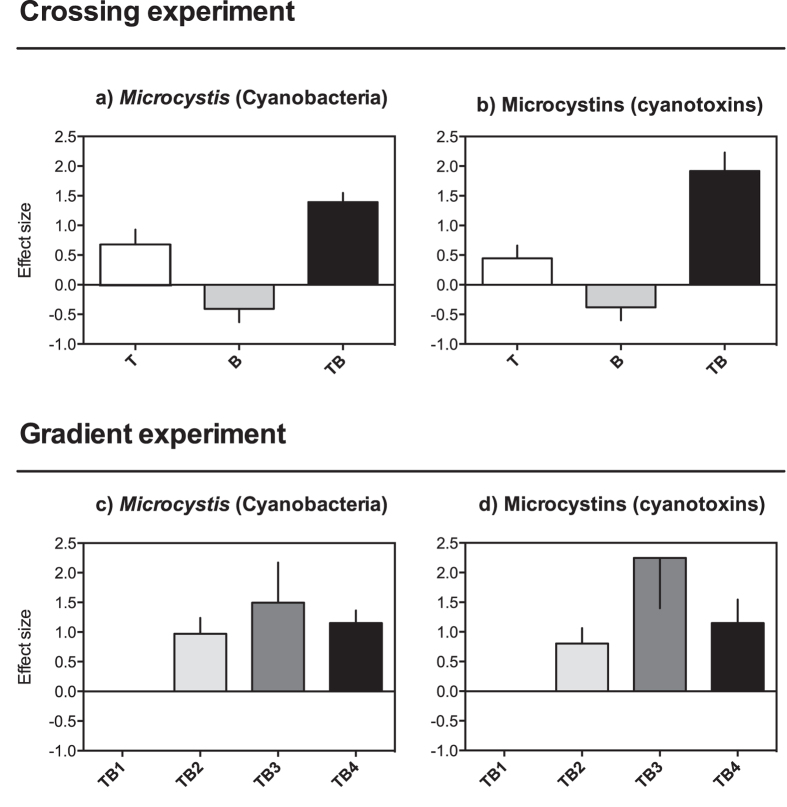
Figure 1. The effects of temperature and brownification on Microcystis (Cyanobacteria) and their toxins.
The temporal mean effect sizes (±SE) of Microcystis and the microcystin concentrations in the crossing (a,b) and gradient (c,d) experiments. In (a,b): T is elevated temperature (+3 °C); B is brownification (double absorbance at 420 nm (used as a proxy for brownification)); and TB is the combination of both factors. In (c,d): TB1 is +1 °C and +50% absorbance; TB2 is +2 °C and +100% absorbance; TB3 is +3 °C and +150% absorbance; and TB4 is +4 °C and +200% absorbance. Note that the X-axis equals the control treatment and that values above or below that line indicate positive or negative treatment effects (warming and/or brownification), respectively, with respect to the control conditions43.

