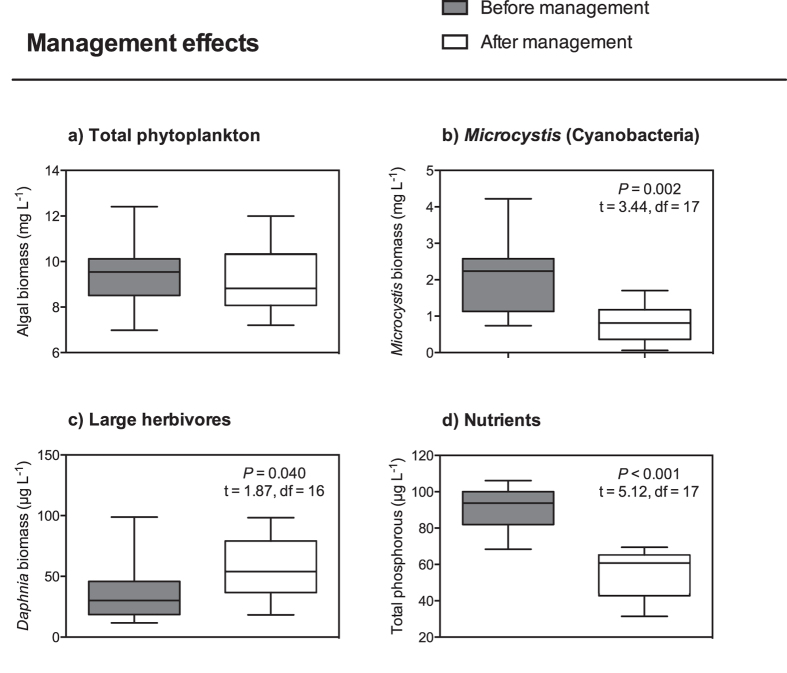
Figure 2. The effects of management through biomanipulation in Lake Ringsjön.
Pairwise comparisons between the periods before (1996–2004; grey boxes) and after (2005–2014; white boxes) biomanipulation in the lake, which started in 2005. Boxplots show the minimum, first quartile, median, third quartile and maximum values of the monthly means from April to October from each year of (a) total phytoplankton biomass (mg L−1), (b) Microcystis biomass (mg L−1), (c) Daphnia biomass (μg L−1) and (d) total phosphorous concentrations (μg L−1). P-values, t-values and degrees of freedom are provided for significant differences (α = 0.05) based on a Student’s t-test (unpaired, one-tailed).

