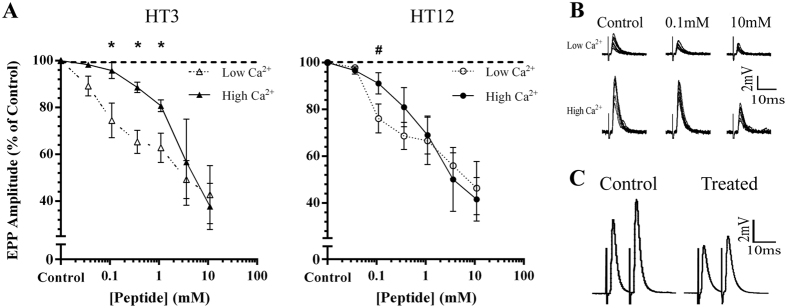
Figure 2.
(A) Dose response for HT3 and HT12 conducted at low (0.3 mM) and high (2.0 mM) [Ca2+]. Normalised end-plate potential amplitudes (±SEM) were recorded at each concentration for HT3 at low (open triangles, n = 3) and high (filled triangles, n = 3) [Ca2+] and HT12 at low (open circles, n = 3) and high (filled circles, n = 4) [Ca2+]. At high [Ca2+] the effects of HT3 and HT12 were less pronounced with higher concentrations of peptide required to elicit a significant decrease in transmitter release (*P < 0.05, Student’s t-test to compare individual HT concentrations at low and high [Ca2+]). (B) representative recordings of EPP responses after incubation with HT12 at low and high [Ca2+]. (C) representative traces (mean of 10 consecutive traces) of paired pulse facilitation at 10 ms delay for control and HT12 (10 mM) treated conditions at high [Ca2+].

