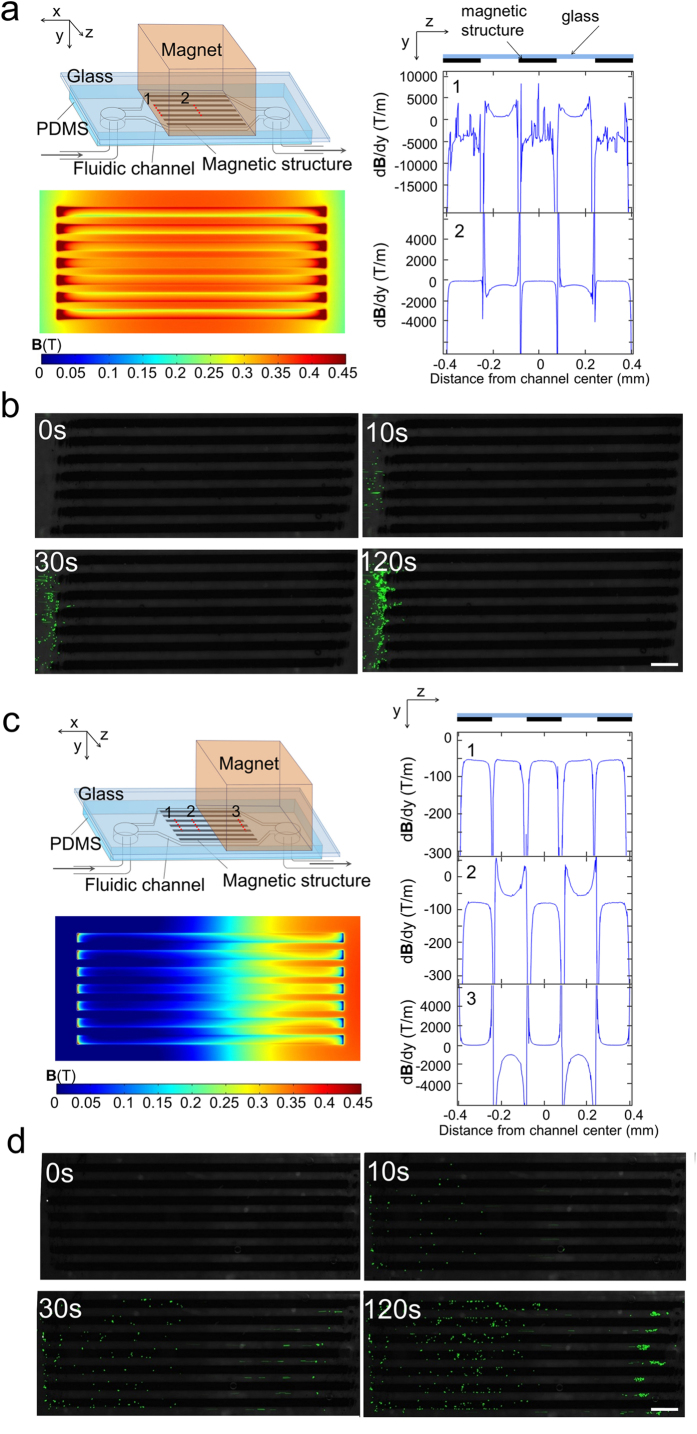
Figure 4. The layout of the magnetic structures and the location of the magnet determine the spatial distribution of trapped cells in a microfluidic channel.
(a) COMSOL modeling of By and dB/dy (in the plane that is within the channel and 10 μm from the glass surface) when the magnet is placed right above, covering the magnetic structure. dB/dy was plotted along the channel width at various locations (1 and 2) along the channel length. The fluctuation in the location 1 data was likely due to numerical artifact. (b) Time-lapse images of cell accumulation in the channel with the setting showed in (a). Scale bar: 500 μm. (c) COMSOL modeling of By and dB/dy when the magnet covers only half of the magnetic structure. dB/dy was plotted along the channel width at various locations (1, 2 and 3) along the channel length. (d) Time-lapse images of cell accumulation in the channel with the setting showed in (c). Scale bar: 500 μm. The dimensions of the microfluidic channel were 2.4 mm (W, z direction) × 100 μm (D, y direction) × 10 mm (L, x direction), and the magnetic structure contained 7 stripes of 160 μm (W) × 4.5 μm (D) × 5 mm (L) uniformly aligned in the channel. Cells were fluorescently labelled with calcein AM green.

