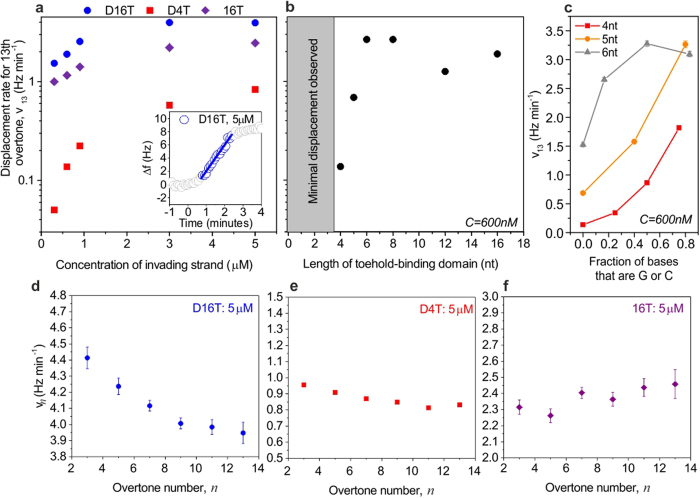
Figure 2. Strand displacement rate, measured for different invader concentrations, toehold lengths, GC content and overtone numbers.
(a) Rate of strand displacement, v13, as a function of invader concentration, for the three invader strands introduced in Fig. 1. (b) Rate of strand displacement as a function of length of toehold binding domain, where the displacement domain of the invading strand was 16nt long and the invader concentration was 600 nM. The sequence of the invader was obtained by truncating D16T. In both (a,b), data corresponds to the thirteenth overtone, which has the shortest penetration depth and is therefore least sensitive to the bulk solution. (c) Rate of strand displacement, v13, for invader strands with toehold binding domains of three different lengths, as a function of the fraction of bases in the toehold binding domain that are G or C. Here, a value of 0.2 indicates that 20% of the bases in the domain are G or C, while the remaining 80% are A or T. (d–f) Overtone-dependence of displacement or binding rate, for the three different invaders. In all graphs, error bars represent standard error on the rate extracted by fitting. Many of the error bars are too small to see; error bars are shown on all points for which they are visible. For each case, the rate was extracted by performing a linear fit to frequency traces (as indicated in inset, part (a), and discussed in the Supplementary Information). The displacing domain was the same for all cases.

