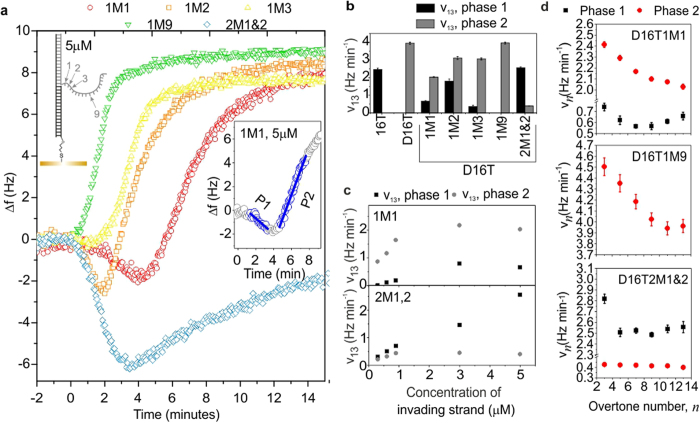
Figure 3. QCM-D results for invading strands with one or more mismatches in the displacing domain.
(a) Frequency changes as a function of time with mismatch(es) present in the displacing domain of the invading strand at the indicated position(s). Inset–definition of the two phases of displacement (P1 = phase 1 = toehold binding and P2 = phase 2 = dissociation) observed using a mismatched invading strand (shown here for D16T1M1, 5 μM). (b,c) show the rates extracted by fitting straight lines to Δf(t), as shown in inset of (a), for indicated invading strands. Imperfectly matched invaders are identified by the short name yMx, where y is the number of mismatches, and x gives their location, as indicated in the sketch in part (a). All invaders have a 16nt toehold binding domain and the full name (as given in the Supplementary Table 1) is therefore obtained by adding ‘D16T’ to the start of this label. For (a) and (b), the concentration of invaders was 5 μM. (a–c) show data for thirteenth overtone. (d) Dependence of reaction rate, vn, on overtone number, n, for the indicated strands, at a concentration of 5 μM. Where visible, error bars represent the standard error on the fitted rate.

