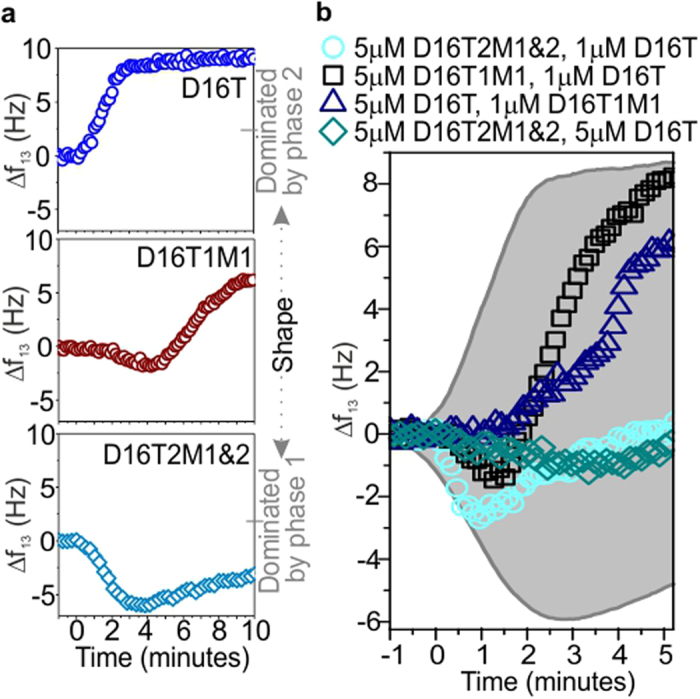
Figure 5. Continuously tuning the shape of the displacement signal.

(a) Defining the range of displacement shapes. Kinetics measured for indicated strands; shape ranges from phase-1-dominated to phase-2-dominated. (b) Measured frequency shift upon addition of indicated mixture of strands. The shaded grey area indicates the range of possible traces. In part (a) every 5th point is plotted; in part (b) every 3rd point is plotted. All plots show the 13th overtone.
