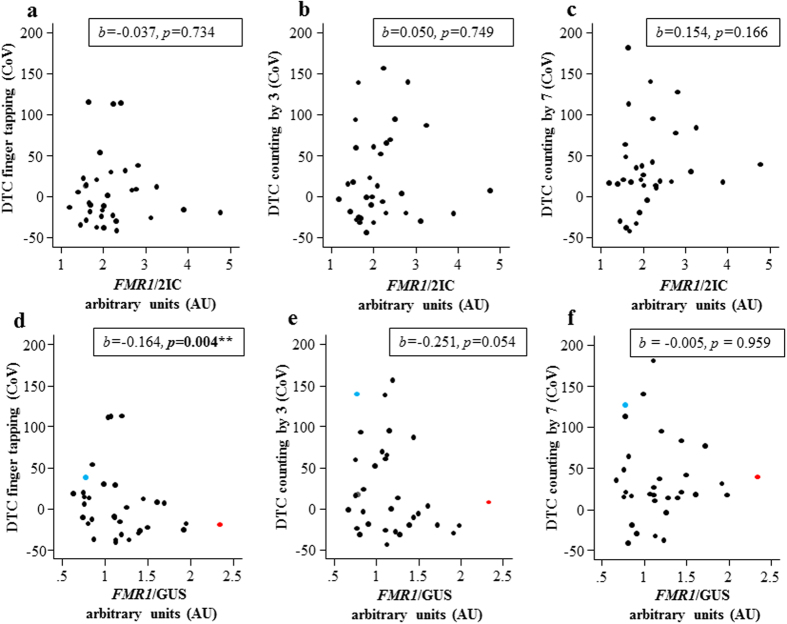
Figure 2.
Relationships between GUS and FMR1 mRNA normalized to expression of different internal control genes in PM females. Scatter plot between FMR1/2IC and the gait step length variability dual-task cost (DTC) for (a) the finger tapping condition, (b) the count by 3′s condition and (c) the count by 7′s condition. Correlation between FMR1/GUS and the gait step length variability DTC for (d) the finger tapping condition, (e) the count by 3′s condition and (f) the count by 7′s condition. Note: The PM female found to be an outlier for the relationship between gait step length variability DTC and the GUS/2IC variable in Fig. 1 is indicated in blue. A PM participant who was an outlier for the relationships between gait step length variability DTC and the FMR1/GUS variable is highlighted in red.

