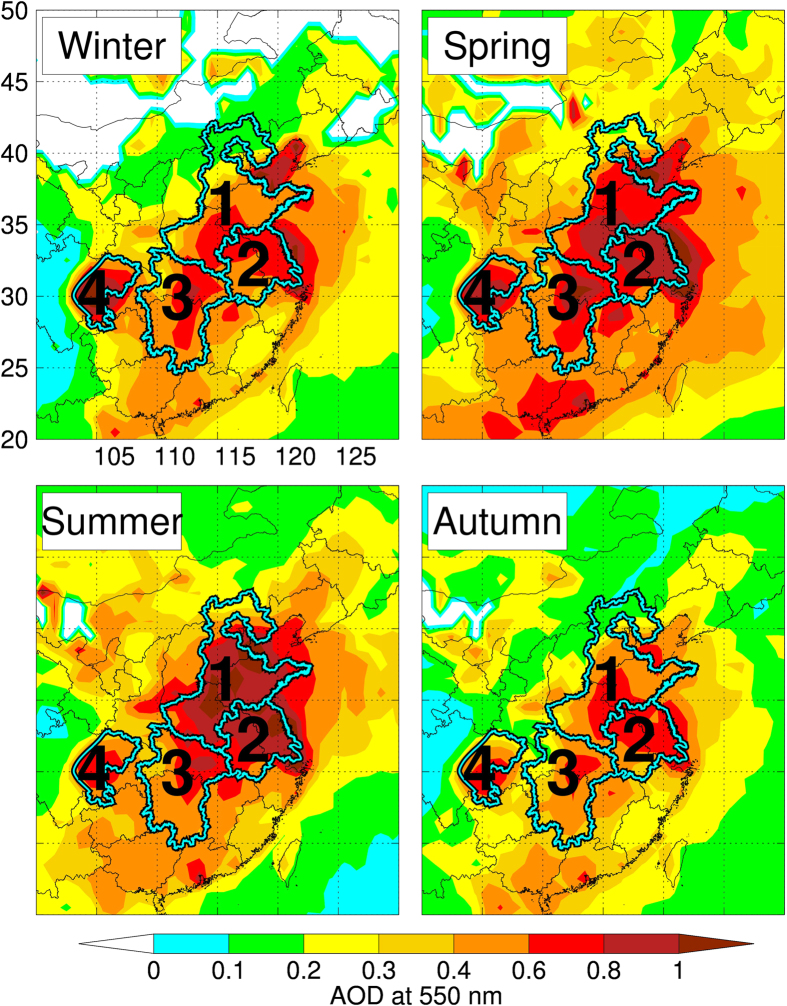
Figure 1. The MODIS AOD horizontal distributions in different seasons (Winter-Dec. Jan. Feb., Spring-Mar. Apr. May., Summer-Jun. Jul. Aug., and Autumn-Sep. Oct. Nov.).
The outlines with numbers represent for different heavy aerosol pollution regions in China. 1 represents for the North China Plain region (NCP); 2 for the Yangtze River Delta region (YRD); 3 for the central eastern China (CEC); and 4 for the Si Chuan Basin (SCB). The map was generated by the IDL software version IDL 8.1 (Exelis, USA), http://www.exelisvis.com/.

