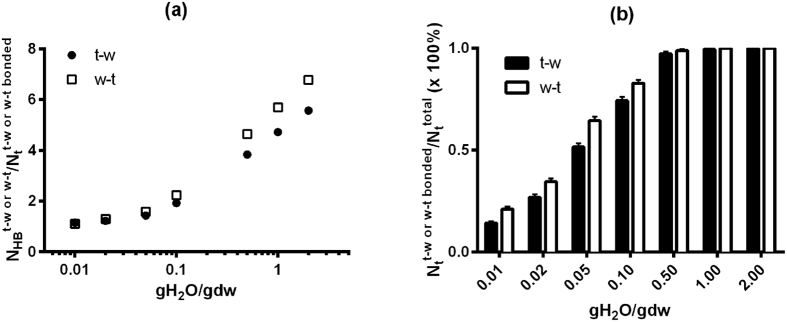
Figure 5.
(a) The average number of H-bonds between trehalose and water molecules per molecule of H-bonded trehalose,  , as a function of water content (gH2O/gdw) at 150 K. Note that the standard deviation is less than 0.08; (b) The percentage of trehalose molecules that are H-bonded to water,
  , as a function of water content at 150 K.

