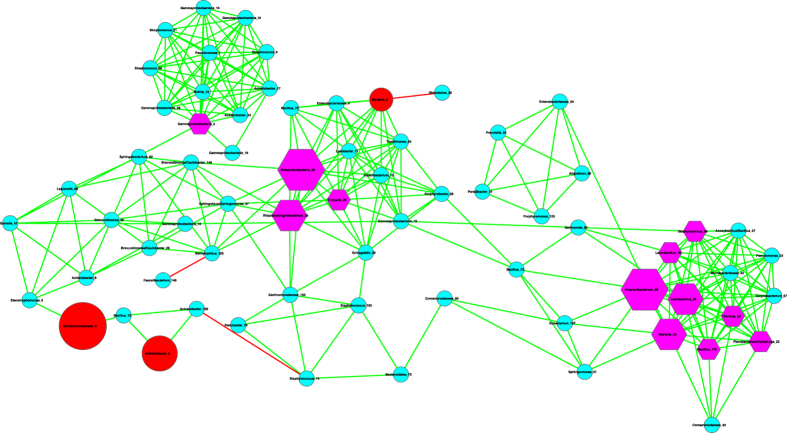
Figure 1. The milk bacterial species interaction network constructed with the pre-chemotherapy samples.
Symbols used: edges in green—positive correlation, edges in red—negative correlation, hexagon in pink—hubs (nodes with the top three highest degrees), cycles in red—MAO (top three most abundant OTUs), and cycles in pink— assuming dual role of hub and MAO.

