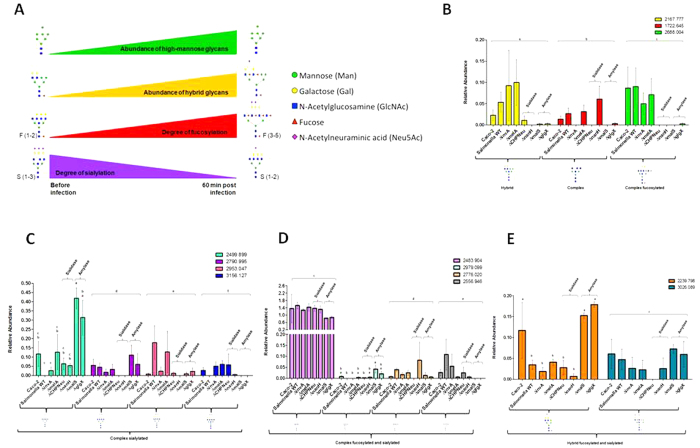
Figure 4. Signature of glycan profiles and how each glycan-degrading enzyme modulates the glycans during infection.
(A) Signature of glycan profiles during infection. There is an increase in abundances of high-mannose and hybrid glycans. Also the glycans are switched from being highly sialylated to highly fucosylated (the degree of fucosylation increases and the degree of sialylation decreases); (B–E) Glycans that are highly regulated by Salmonella glycan-degrading enzymes during infection. The comparisons between CHPNeu and nanH (Sialidases) and malS and glgX (Amylases) are shown. LSD was used for statistical analysis. Error bars indicate SEM between 3 biological replications. Levels not connected with the same letter are significantly different. Statistical analysis was done within each structure.

