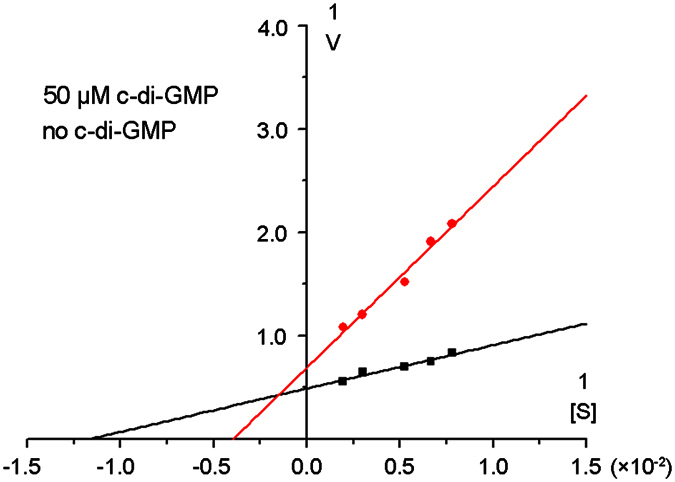
Figure 5. Double reciprocal plots of the kinetic study of Dcsbis protein in absent and present of c-di-GMP.

This analysis was done by measuring three independent sets of experiments with 5 substrate concentrations (128 μM, 150 μM, 190 μM, 333 μM, 512 μM). The plots are generated by plotting 1/V as a function 1/[S]. The intercept on the vertical axis is 1/Vmax, and the intercept on the horizontal axis is −1/KM.
