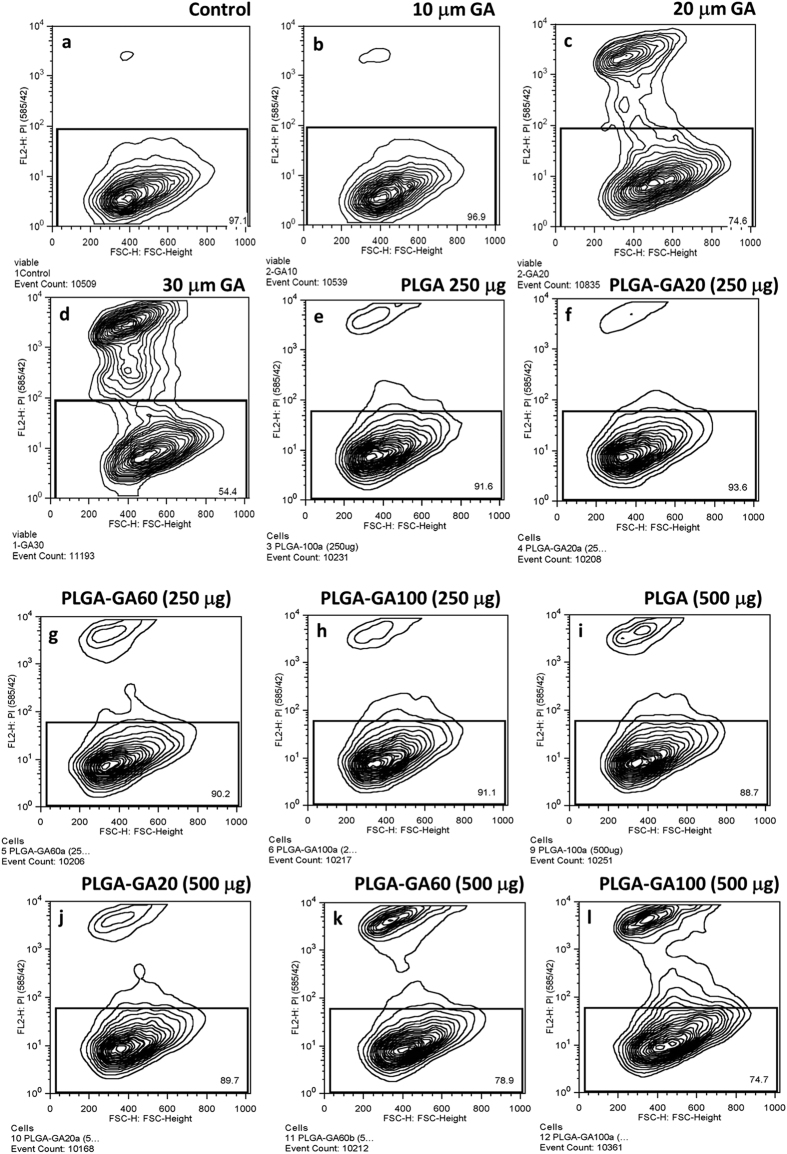
Figure 4. Concentration dependent toxicity in caco-2 cells.
Contour plots of viable cells. (a) Control. (b–d) Increasing levels of cell death observed by increasing the amount of GA used to treat the cells with 10 μM treatment showing negligible cell death. (e–h) Cells treated with 250 μg PLGA-GA/PLGA NS with increasing amount of surface GA density showing negligible to very low cell death with no significant differences between groups. (i–l) Cells treated with 500 μg PLGA-GA/PLGA NS with increasing amount of surface GA density showing more cell death compared to 250 μg dose which may be due to the cumulative effect of excessive polymer and more GA available on the surface. The cell death was lower compared to the groups with 20 and 30 μM GA treated cells.

