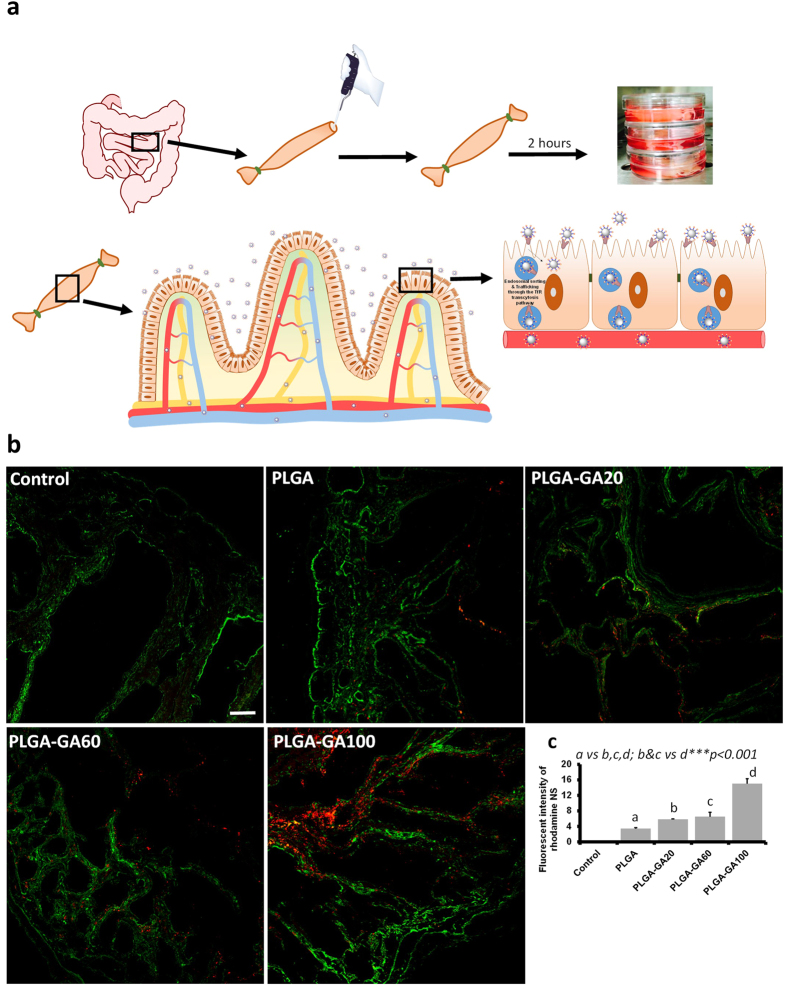
Figure 5. Ex vivo Transport of PLGA-GA NS through Intestinal Barrier.
(a) Illustration of the experimental setup and mechanism of NS transport across intestinal tissue. (b) Representative fluorescence images of the ex vivo cryosections of jejunum obtained by CLSM (12×, scale bar represents 50 μm). TfR was stained using anti-TfR antibody (green). (c) Mean fluorescence intensity (MFI) quantified in the intestinal sections.

