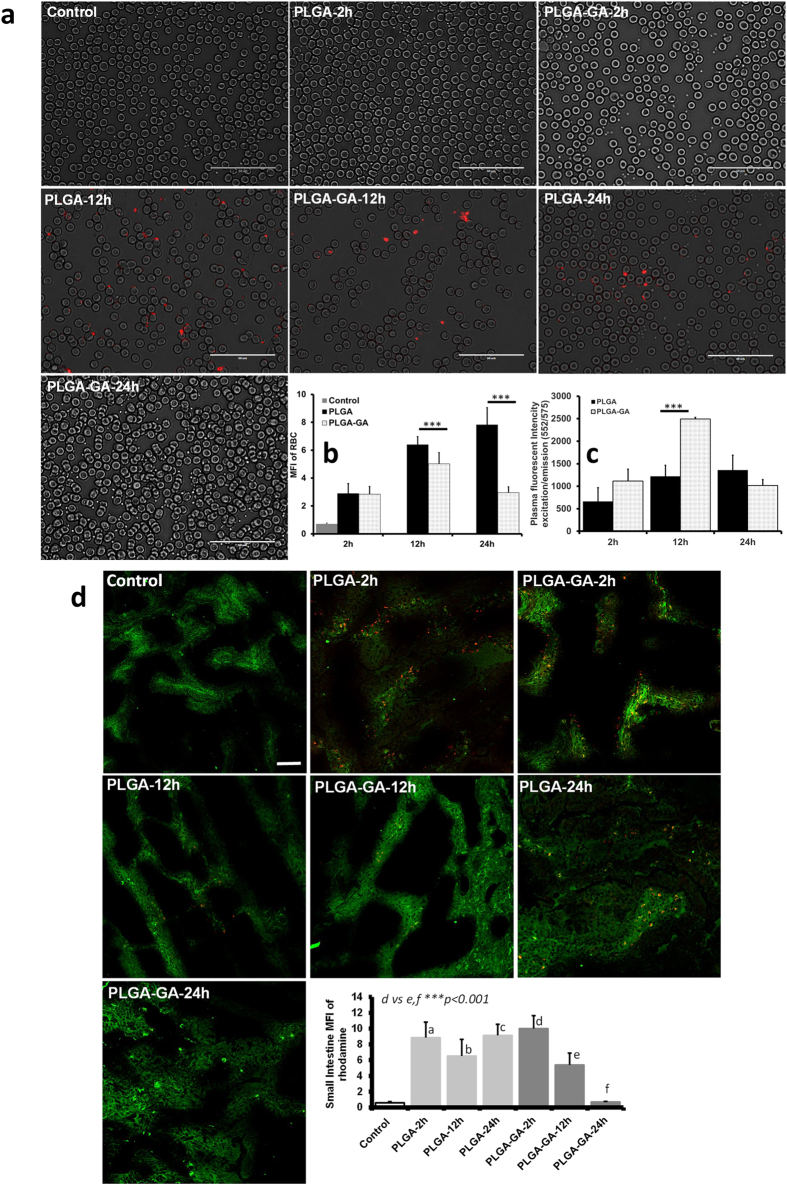
Figure 6. Kinetics of Fluorescent PLGA-GA NS.
(a) Images of blood smears obtained using EVOS-FL microscope (60×, scale bar represents 50 μm). (b) MFI quantified in the blood smears. (c) Plasma fluorescence plotted as ex/em (552/575) profiles. Representative images and quantified MFI of rhodamine (red) in tissue sections (20×, scale bar represents 50 μm). Small intestine TfR is labelled green demonstrating the receptor presence on apical side.

