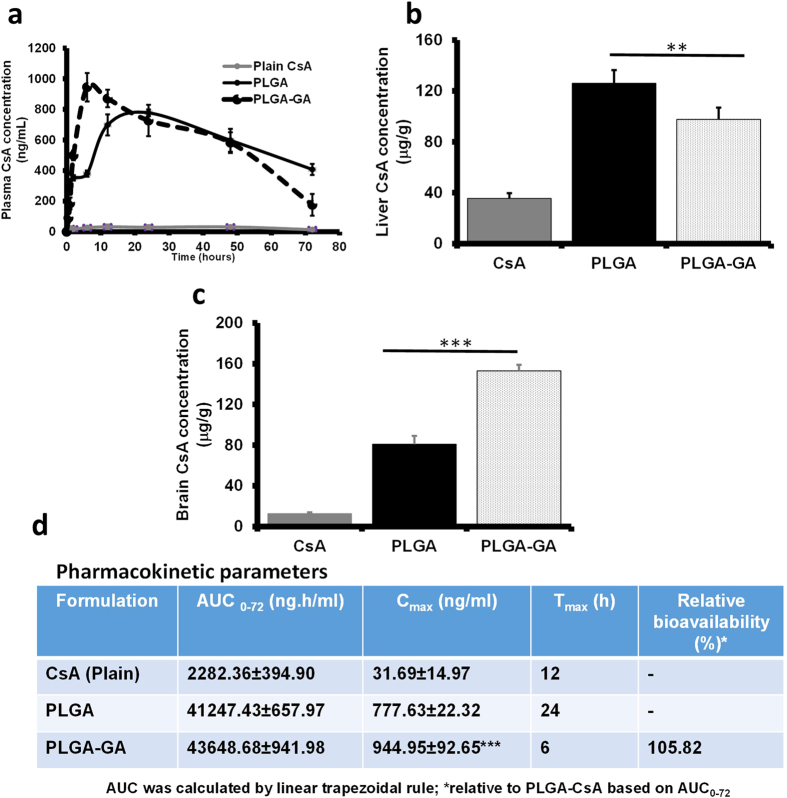
Figure 7. Cyclosporine A (CsA) Kinetics.
(a) Plasma concentration profile of CsA over 72 h period (Grey: Plain CsA; Solid Black: PLGA NS CsA; Dotted Black: PLGA-GA NS CsA). (b) Liver distribution of CsA at the end of the study (72 h). (c) Brain distribution of CsA at the end of the study (72 h). (d) Pharmacokinetics parameters.

