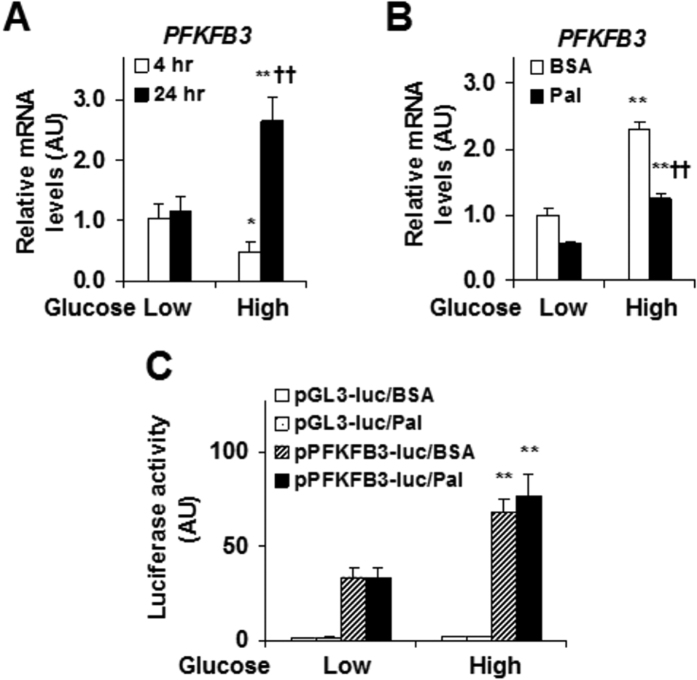
Figure 5. Effects of glucose and palmitate on PFKFB3 gene transcription.
CMT-93 cells were treated as described in the methods. (A) Time course and dose responses of glucose regulation of PFKFB3 expression. (B) Effects of glucose and palmitate on PFKFB3 expression. (C) Nutrient regulation of PFKFB3 promoter activity. For (A–C), data are means ± SEM, n = 4–6. *P < 0.05 and **P < 0.01 High glucose vs. Low glucose for the same time/treatment (BSA or Pal); ††P < 0.01 24 hr vs 4 hr (A) or Pal vs. BSA (B) for the same glucose condition. BSA, bovine serum albumin; Pal, palmitate.

