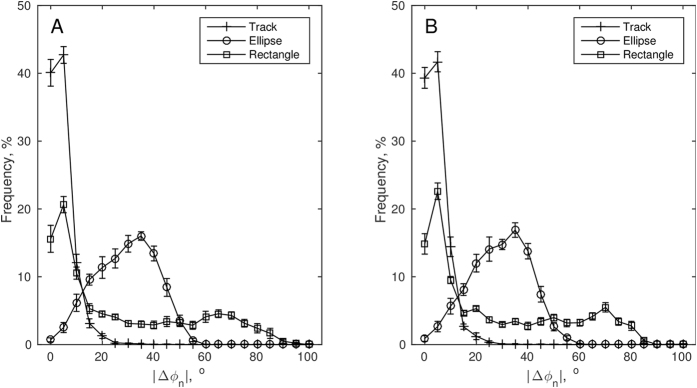
Figure 2.
Distributions of inner-side (A) and outer-side (B) absolute inter-stride-heading-angle-differences. Shown are bin averages (SE) for the histograms computed in each trial. The three experimental conditions are identified here in terms of the respective shapes of the pathway: track (unconstrained), ellipse (constrained), and rectangle (perturbed).

