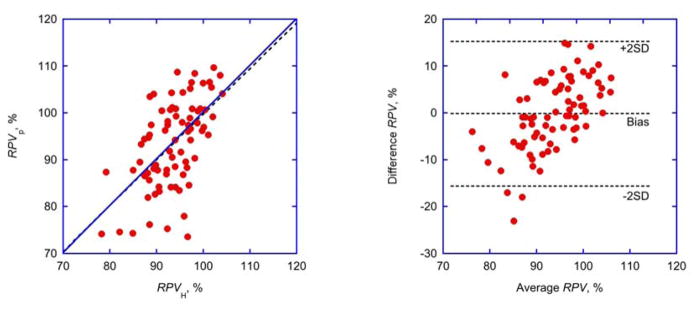
Fig. 2. Comparison of techniques.
Identity plot (left panel; linear regression shown as broken line) and Bland-Altman plot (right panel; bias and limits of agreement shown as broken lines) of relative plasma volumes determined from hematocrit changes (RPVH, Eq. 4) or from plasma volumes (RPVp, Eq. 6). For parameters of linear regression see Tab. 4.

