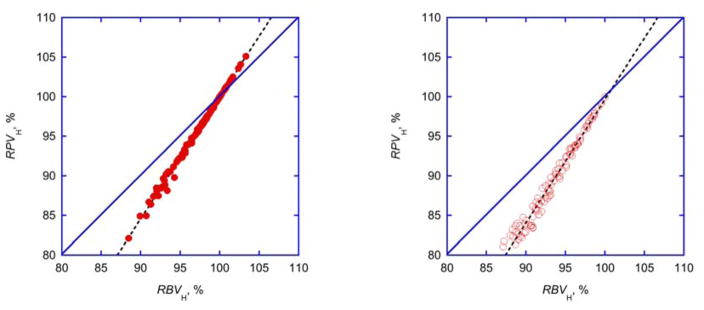
Fig. 4. Comparison of relative volumes.
Identity plots of relative plasma (RPVH) and blood volumes (RBVH) calculated from hematocrit changes (Eq. 4) shown for experimental (left panel) and simulated (right panel) data. Simulated data (n=100, open symbols) were derived from evenly distributed random baseline hematrocrit (30<H0<45%) and an evenly distributed random hematocrit increase (0<(H-H0)<5%). Linear regressions are shown as broken lines. For parameters of linear regressions see Tab. 4.

