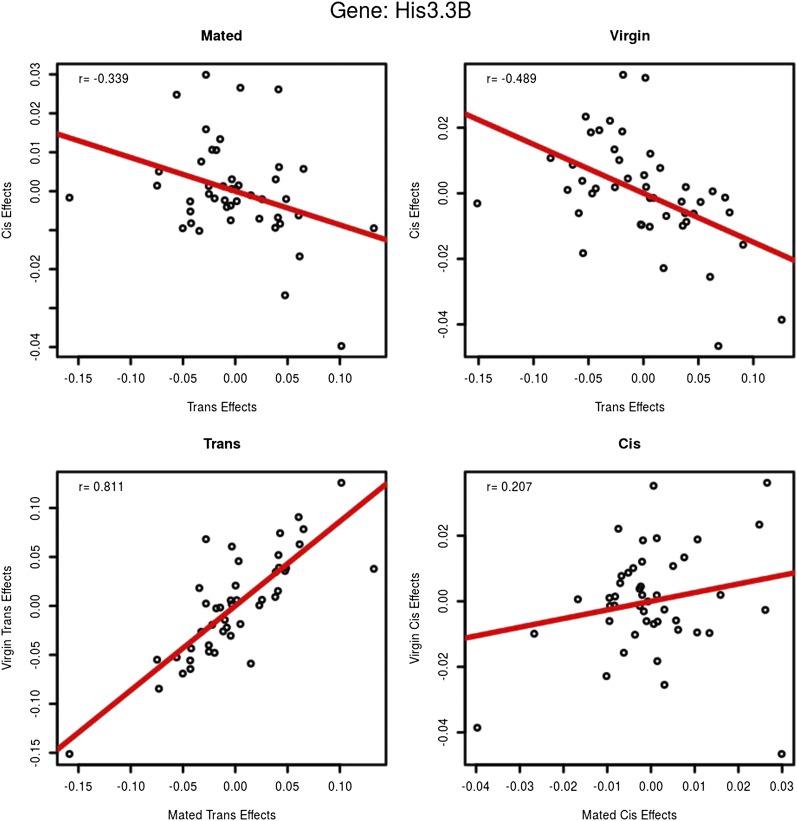
Figure 5.
His3.3B: cis- and trans-estimates. This gene was chosen at random as an example to demonstrate how cis- and trans-effects were compared. Each circle represents one testcross/F1-hybrid line. The top row compares cis- and trans-estimates within environment. The x-axis is the estimated trans-effect and the y-axis is the cis-effect. Cis- and trans-effects are negatively correlated for this exon (85% of exons show negative associations in both environments). The bottom row compares cis- and trans-effects across environments. The x-axis is the mated environment and the y-axis is the virgin environment. In this example, trans-effects are positively associated between mated and virgin flies. Cis effects are less correlated in this example but the correlation is positive (99% of all exons are positively correlated for both cis- and trans-effects across environments with a median correlation of 0.83 for cis and 0.95 for trans). The red line is the regression. Figure S4 shows the same relationships between cis- and trans-effects across all crosses and exons.

