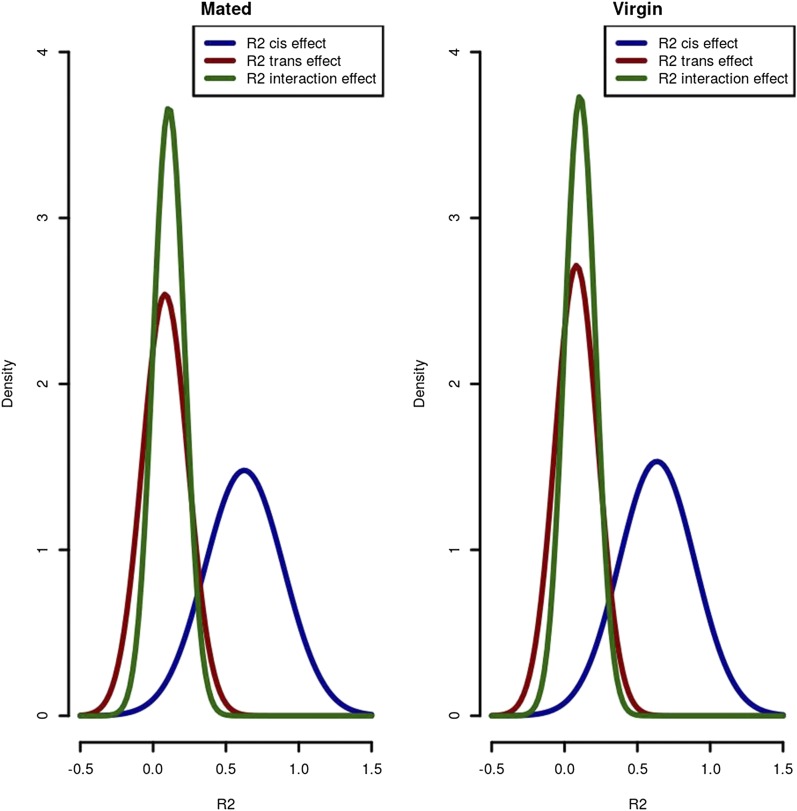
Figure 6.
The distribution of R2 for the regression Yij = μ + Ci + Ti + Ci × Ti, where Y is Ci is the estimate of cis, and Ti is trans for line i for each exon j. R2 is an estimate of the contribution of cis-interactions, trans-interactions, and cis- by trans-interactions to AI. Distributions of R2 are similar in the mated and virgin environments. Cis-effects explain at least 45% of the variation in expression for 75% of exons tested. Trans-effects explain 8% of the variance on average. The cis- by trans-interaction explains an additional 11% of the variance on average.

