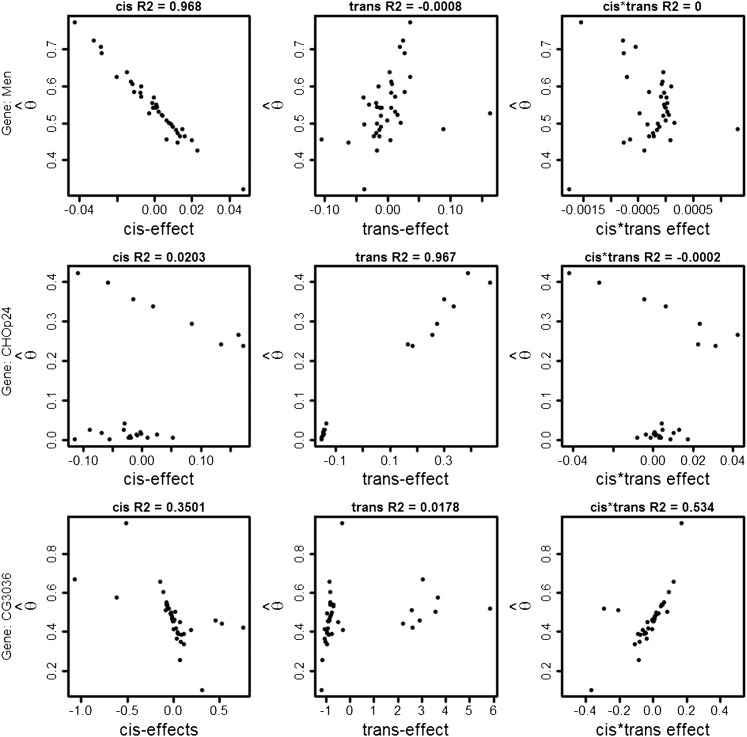
Figure 7.
Three exons displaying different patterns of association between cis-interactions, trans-interactions, and cis- by trans-interactions and Each point is a testcross/F1 hybrid. On the y-axis is the estimated AI () and on the x-axis in left, center, and right columns are cis, trans, and cis by trans. The top row represents the gene Men. This gene has ∼97% of the variance explained by the cis-effect and a negative association between cis and AI. The middle row represents the gene CHOp24. This gene has ∼97% of the variance explained by trans-effects. The bottom row represents the gene CG3036. This gene has ∼53% of variance explained by the cis- by trans-interaction. Figure S3 depicts lack of association between cis- and trans-effects with when all crosses and all exons are considered simultaneously.

