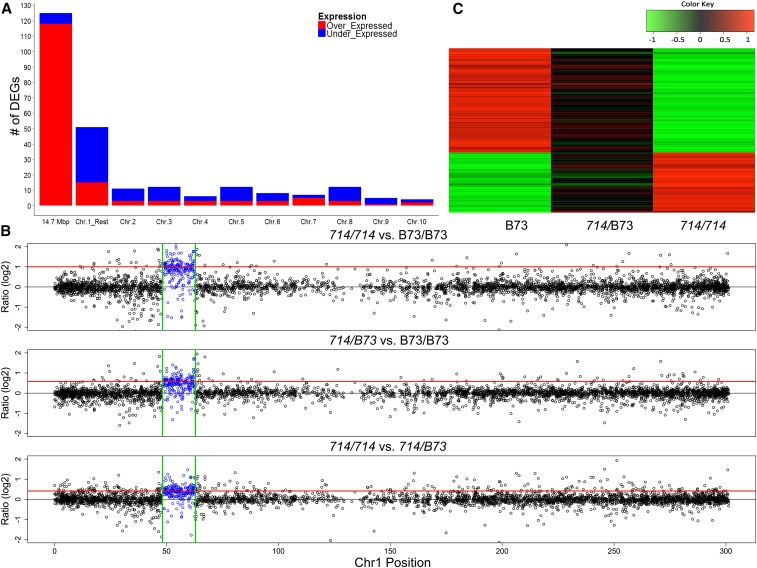
Figure 2.
DEGs and dosage-dependent expression pattern revealed by RNA-seq. (A) The distribution of DEGs between homozygous p1-ww714 and B73 plants identified by RNA-seq. Bars indicate the numbers of overexpressed (red) and underexpressed (blue) DEGs identified in the 14.6-Mb duplicated region (first bar), the remainder of chromosome 1 (second bar), and other chromosomes. (B) Ratios of chromosome 1 gene expression among three genotypes as determined by RNA-seq. Log2 fold changes in transcript levels were plotted for pairwise comparisons among p1-ww714/p1-ww714, B73/B73, and p1-ww714/B73 sibling plants. Expression ratios are shown for all genes on chromosome 1. The gene copy-number ratios (log2) of p1-ww714/p1-ww714 vs. B73/B73, p1-ww714/B73 vs. B73/B73, and p1-ww714/p1-ww714 vs. p1-ww714/B73 are 1, 0.585 and 0.415, respectively; these values are indicated as the solid red lines. The x-axis indicates the position of each gene in Mb on maize chromosome 1; the y-axis indicates the transcript level ratios (log2) among the three tested genotypes. The segment duplicated in p1-ww714 (48.1–62.7 Mb) is indicated by the two green vertical lines; expression ratios of genes within this segment are indicated in blue. (C) Trans effects on unduplicated genes. Heat map of transcript ratios (log2) of 90 DEGs unlinked with the duplicated region: 33 genes overexpressed (red) and 57 genes underexpressed (green) in p1-ww714/p1-ww714 vs. B73/B73. The transcript ratios were compared among B73/B73, p1-ww714/B73, and p1-ww714/p1-ww714 sibling plants as determined from mRNA-seq data.

