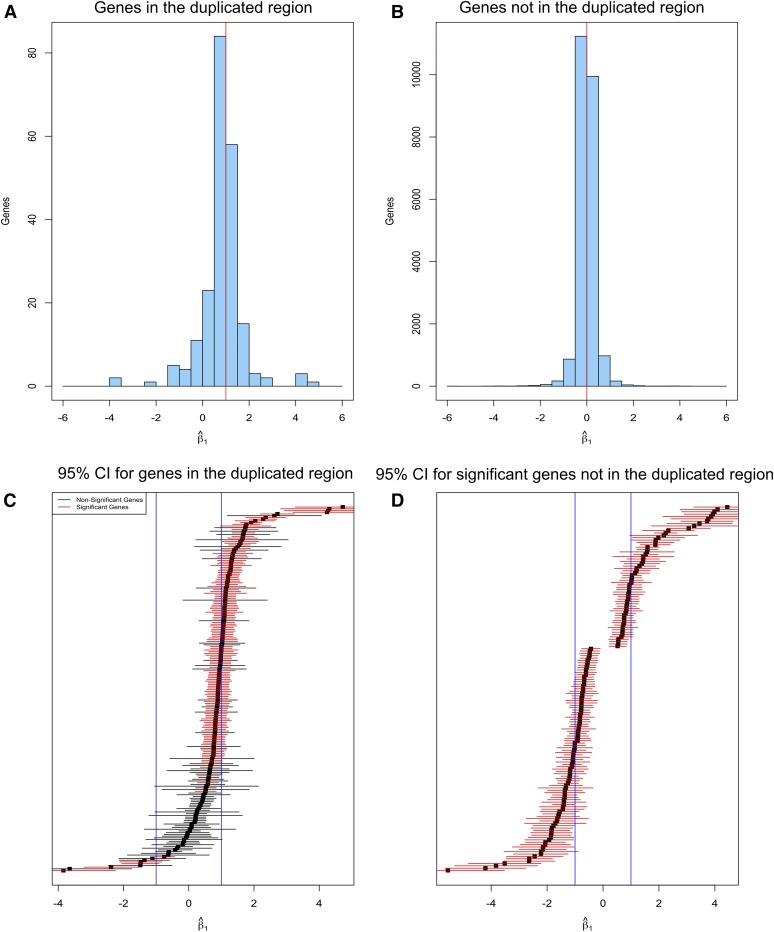
Figure 3.
Statistical test of cis- and trans-acting dosage effects. (A and B) Distributions of estimated values of β1 for levels of gene transcripts in p1-ww714/p1-ww714 vs. B73/B73. A log-linear model was applied to test the hypothesis that gene transcript level is directly proportional to gene dosage. The histograms show the numbers of genes (y-axis) with the indicated estimates of β1 (x-axis). The dosage-effect hypothesis predicts that β1 = 1 for genes within the duplicated segment (A), and β1 = 0 for genes not in the duplicated region (B). The predicted values of β1 are indicated by the red lines. (C and D) 95% C.I. for each estimated β1 value. (C) 95% C.I. of β1 value for each gene within the duplicated region. Red represents significantly DEGs, and black indicates non-DEGs. (D) 95% C.I. of β1 value for each significantly DEG located outside the duplicated region.

