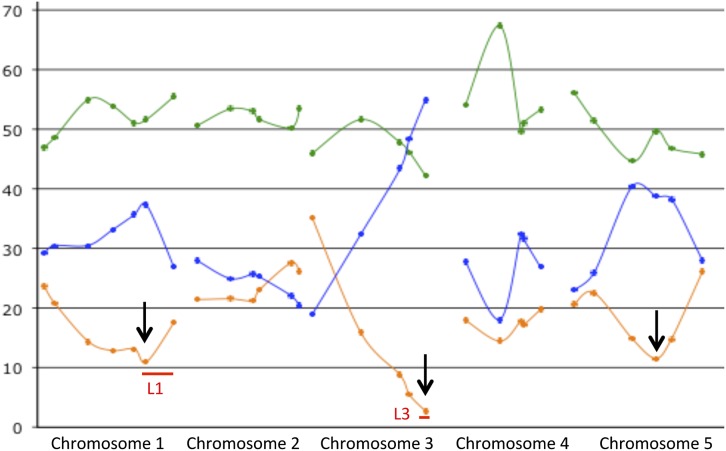
Figure 4.
Genome-wide analysis of allele segregation in the Mr-0 × Sha F2 family. The plots show the percentage of plants heterozygous (green), homozygous Mr-0 (blue), and homozygous Sha (orange) at each marker. Arrows indicate the markers where the bias against the Sha allele is maximal (see Table S2 for genotyping data). Red bars indicate the locations of the L1 and L3 loci.

