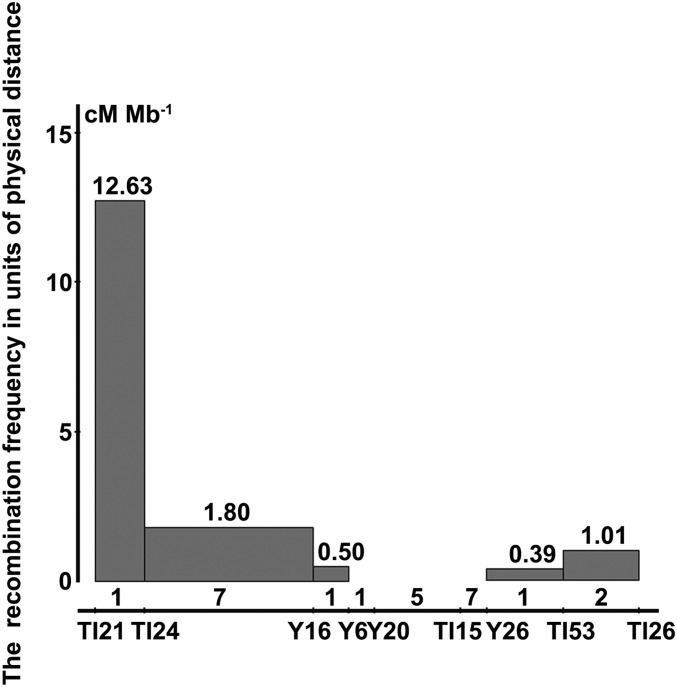
Figure 4.
Evaluation of recombination rate across the primary mapping region (754 kb). The x-axis is positioned along the markers used in fine mapping, and the y-axis shows the number of recombination rate, that is the recombination frequency in units of physical distance (cM/Mb−1). The number of retrotransposons is shown above the markers.

